Free Access
Fig. 3
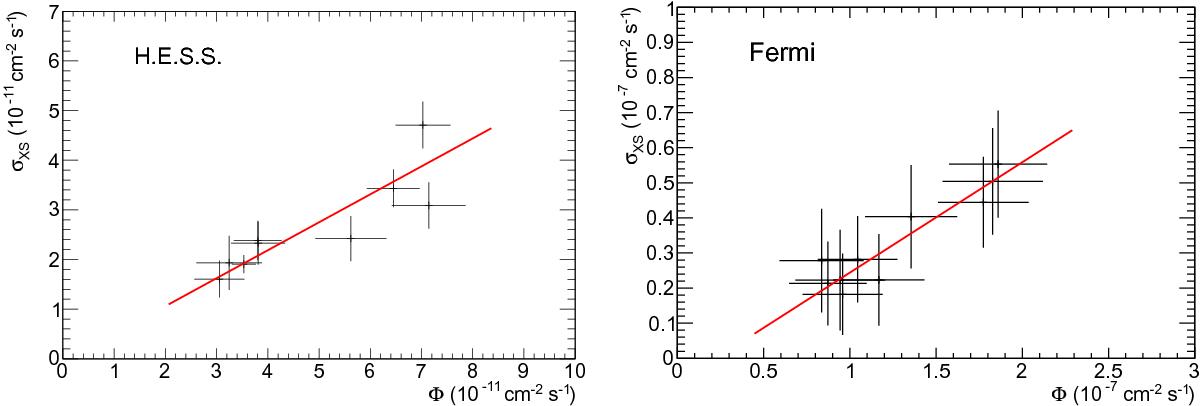
Scatter plot of the excess rms and the average flux for the H.E.S.S. (left) and Fermi-LAT (right) data. Each flux and excess rms values are computed using at least 20 adjacent light curve points. A linear fit is shown in red.
This figure is made of several images, please see below:
Current usage metrics show cumulative count of Article Views (full-text article views including HTML views, PDF and ePub downloads, according to the available data) and Abstracts Views on Vision4Press platform.
Data correspond to usage on the plateform after 2015. The current usage metrics is available 48-96 hours after online publication and is updated daily on week days.
Initial download of the metrics may take a while.