Fig. 4
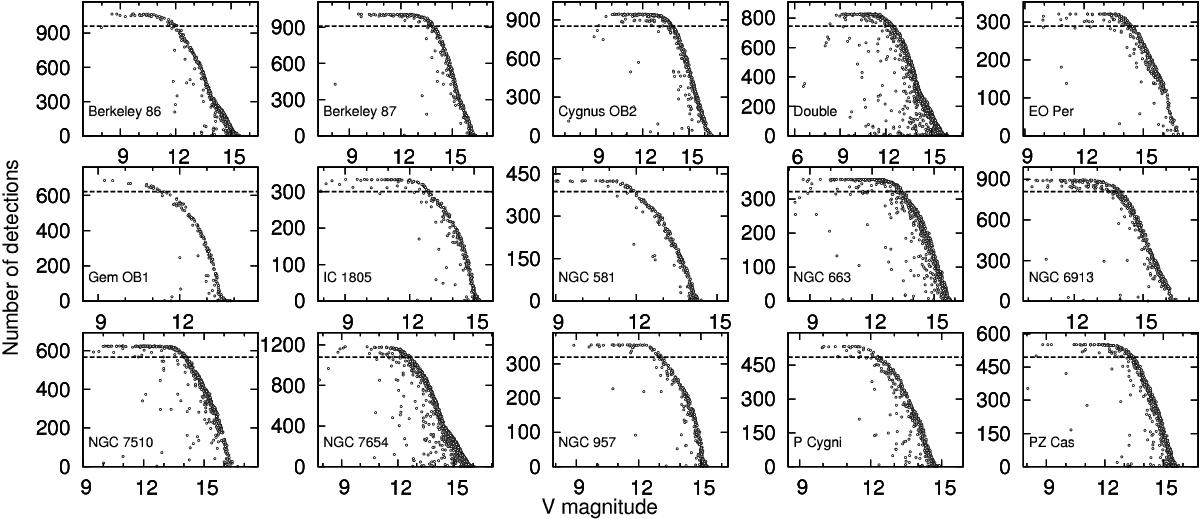
Number of detections per star as a function of V magnitude for each of the fields. The dashed line represents the 90% detection limit. We obtained the limiting V magnitudes from the graphs by assessing the intersection of the 90% line with the spine of the data. Stars above the 90% line are considered as stars with good photometric quality.
Current usage metrics show cumulative count of Article Views (full-text article views including HTML views, PDF and ePub downloads, according to the available data) and Abstracts Views on Vision4Press platform.
Data correspond to usage on the plateform after 2015. The current usage metrics is available 48-96 hours after online publication and is updated daily on week days.
Initial download of the metrics may take a while.