Free Access
Fig. 11
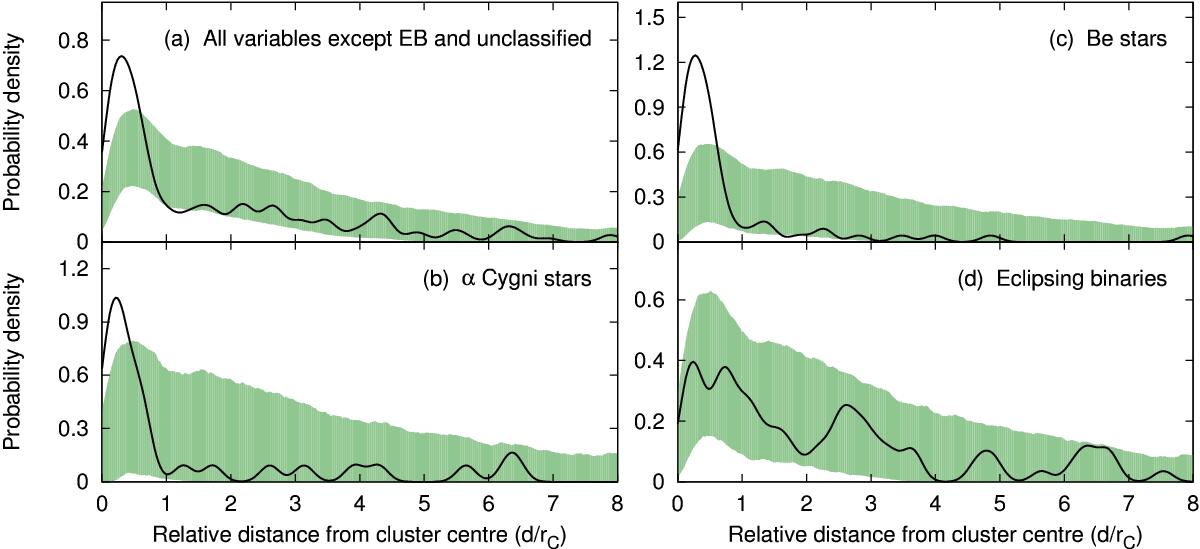
Probability density of variable stars at relative distance from the cluster centre. The coloured area represents the 99.7% confidence limits calculated from all stars in our fields. The solid line is the probability density calculated only from the labelled types of variables.
Current usage metrics show cumulative count of Article Views (full-text article views including HTML views, PDF and ePub downloads, according to the available data) and Abstracts Views on Vision4Press platform.
Data correspond to usage on the plateform after 2015. The current usage metrics is available 48-96 hours after online publication and is updated daily on week days.
Initial download of the metrics may take a while.