Fig. 1
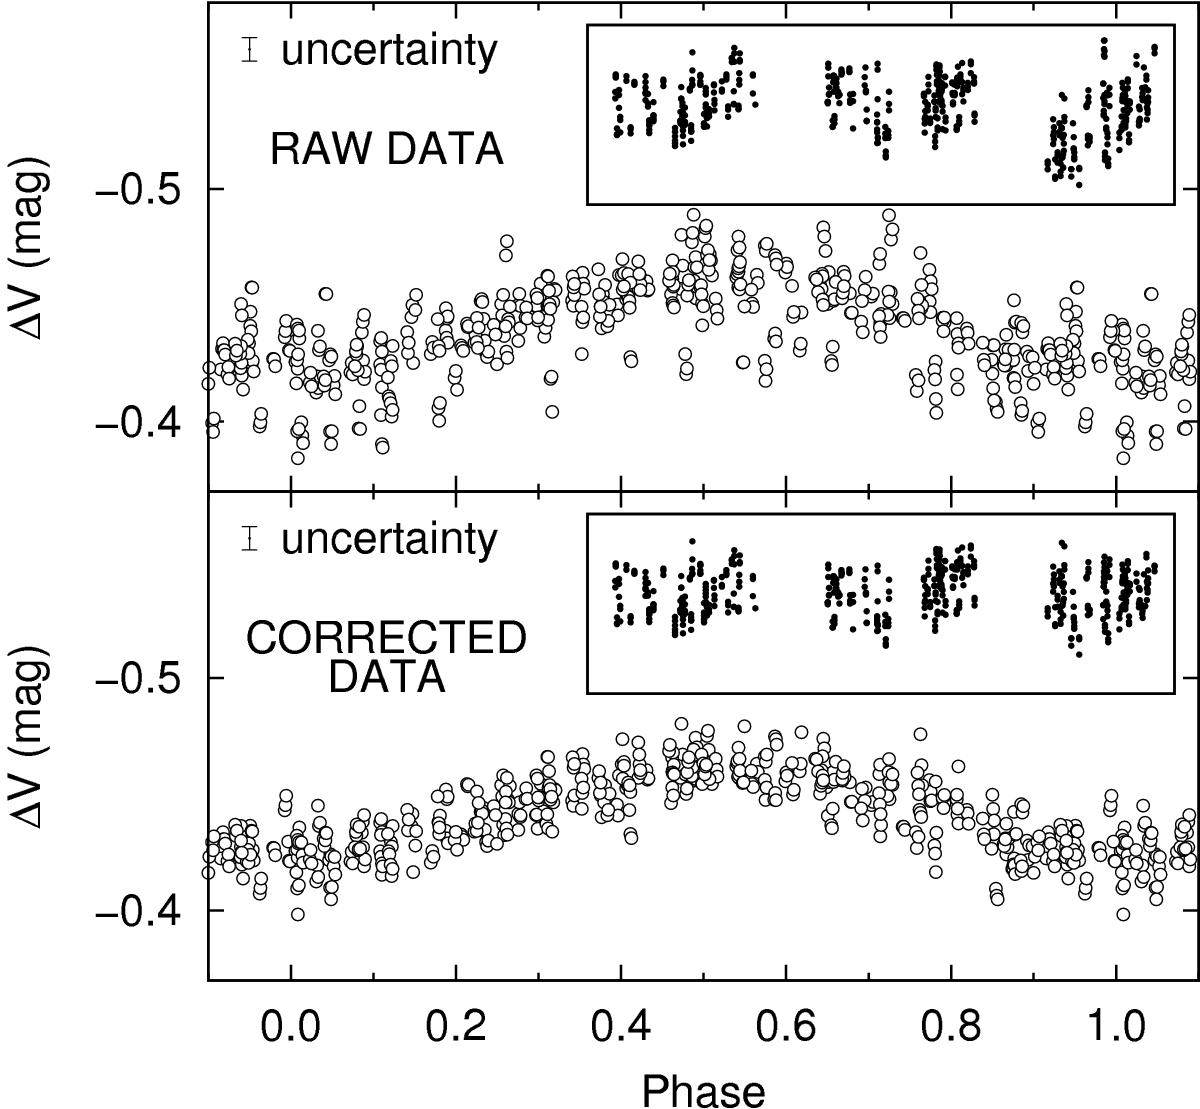
Example light curve correction for SPB star BD+59 2692. The light curve is folded with a period of 1.3032 days. The upper panel is the raw data and the lower panel is the final data that are obtained after using the correction surfaces. The main panels show a folded phase-curve and the small panels show light curves in time domain before and after correction.
Current usage metrics show cumulative count of Article Views (full-text article views including HTML views, PDF and ePub downloads, according to the available data) and Abstracts Views on Vision4Press platform.
Data correspond to usage on the plateform after 2015. The current usage metrics is available 48-96 hours after online publication and is updated daily on week days.
Initial download of the metrics may take a while.