Fig. 5
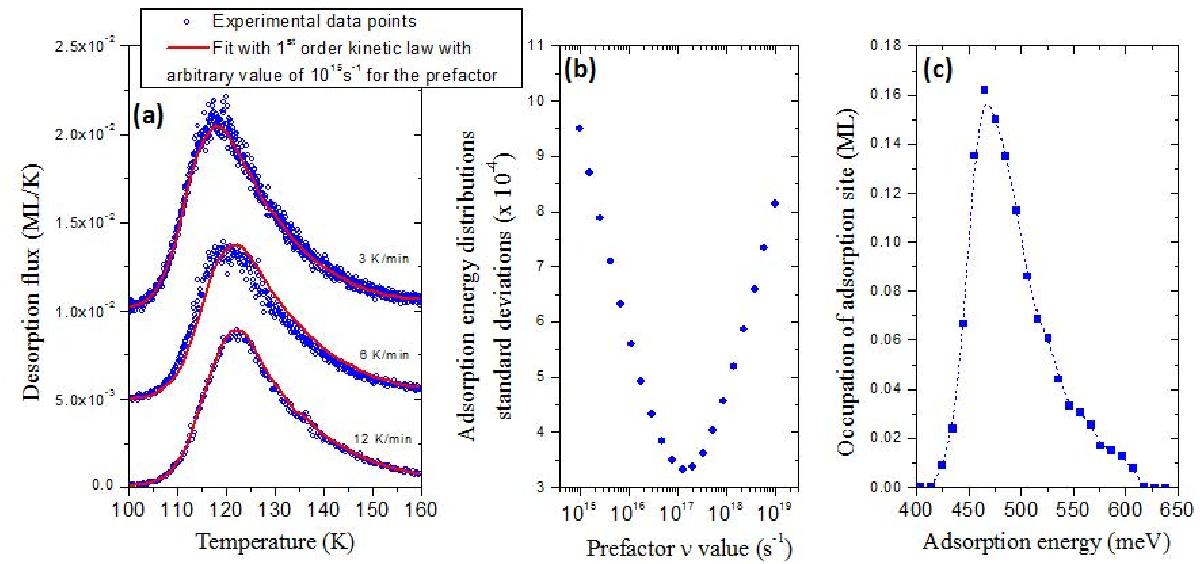
a) Set of TPD curves of 0.2 ML of CH3CN adsorbed on α-quartz (0001) performed at 3 K min-1, 6 K min-1, and 12 K min-1. Straight lines are the fit of these data using a first order kinetic Polanyi-Wigner law with a distribution of adsorption energy using a prefactor of 1015 s-1. b) Search for the best value for the prefactor ν: plot of the standard deviation of the three minimum occupied adsorption energies as extracted from the fits of the three TPD curves. The minimum of the curve give the best choice for ν. c) Adsorption energy distribution corresponding to 0.2 ML of CH3CN on quartz using the best choice for the prefactor.
Current usage metrics show cumulative count of Article Views (full-text article views including HTML views, PDF and ePub downloads, according to the available data) and Abstracts Views on Vision4Press platform.
Data correspond to usage on the plateform after 2015. The current usage metrics is available 48-96 hours after online publication and is updated daily on week days.
Initial download of the metrics may take a while.