Fig. 4
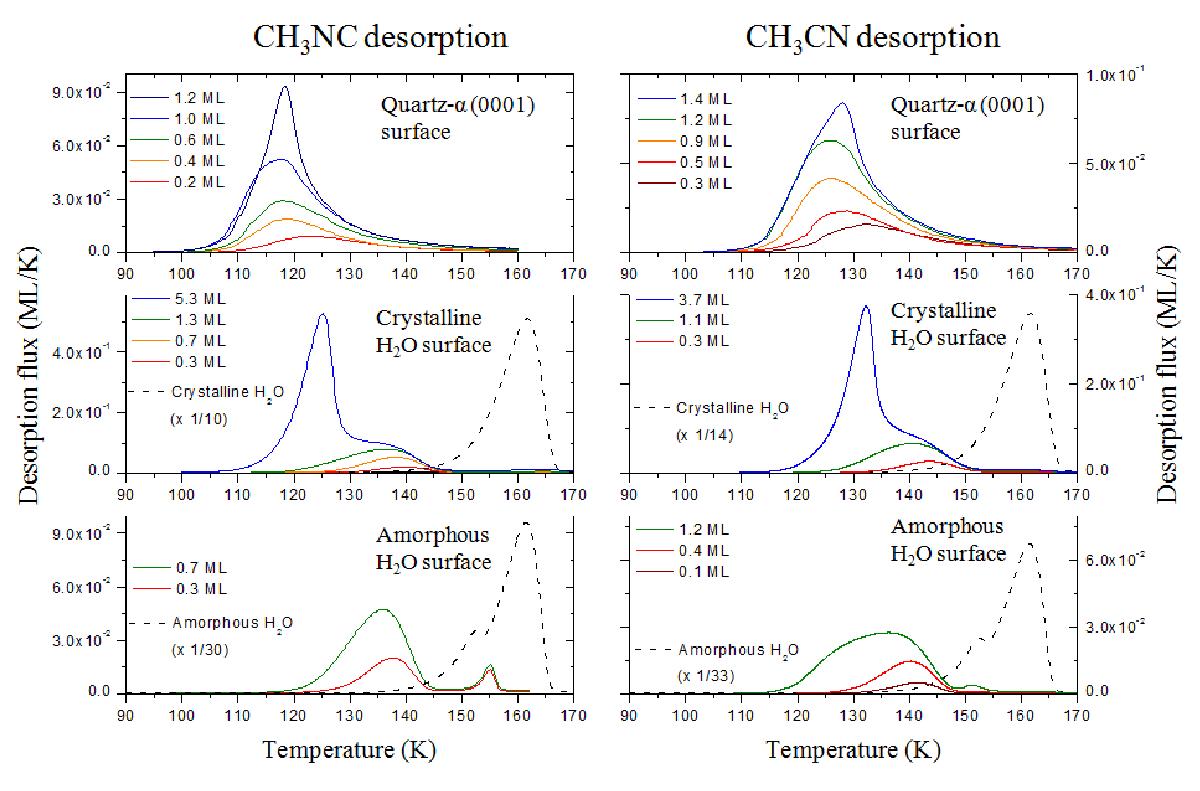
TPD curves of several initial coverages of CH3NC (left) and CH3CN (right) adsorbed on α-quartz (0001) surface, and on crystalline and compact amorphous water ice surface. Applied heating rates are 12 K min-1 on quartz, and 10 K min-1 on water surfaces. TPD curves of multilayers (≈50 ML) of crystalline and amorphous water ice are shown in dashed lines for comparison.
Current usage metrics show cumulative count of Article Views (full-text article views including HTML views, PDF and ePub downloads, according to the available data) and Abstracts Views on Vision4Press platform.
Data correspond to usage on the plateform after 2015. The current usage metrics is available 48-96 hours after online publication and is updated daily on week days.
Initial download of the metrics may take a while.