Fig. 2
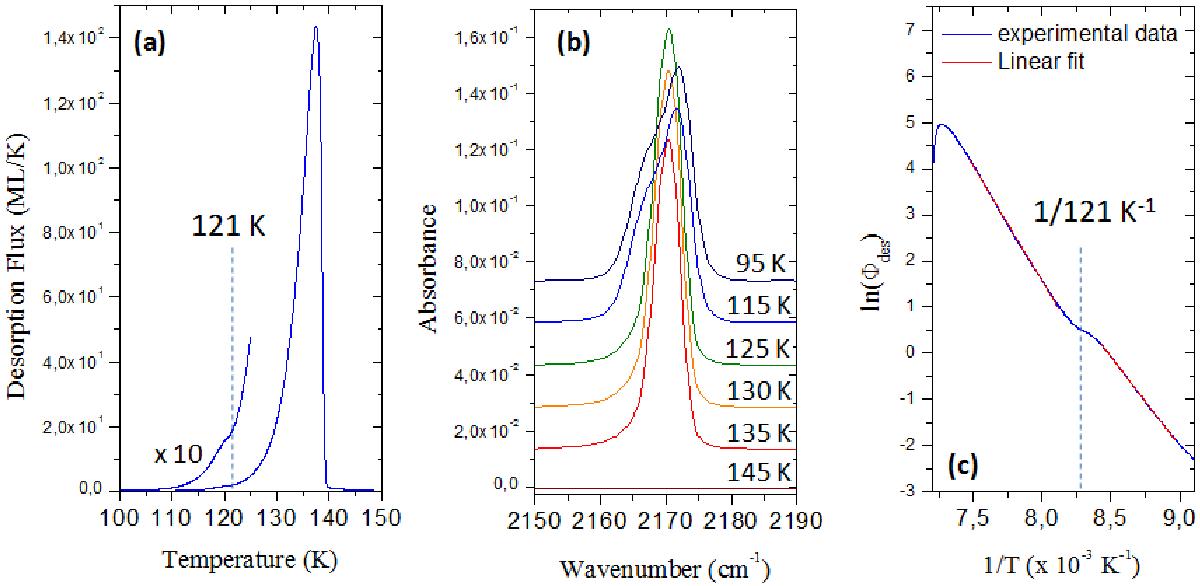
a) TPD curve, with a heating rate of 2 K min-1, of ~800 ML of pure CH3NC deposited on polycrystalline gold at 90 K. The beginning of the desorption has been magnified by a factor of 10. b) Infrared spectra in the region of the NC stretching vibration, during the warming up of the ice. c) Plot of the logarithm of the desorption flux as a function of the inverse of the temperature. Lines are linear fits of the plot.
Current usage metrics show cumulative count of Article Views (full-text article views including HTML views, PDF and ePub downloads, according to the available data) and Abstracts Views on Vision4Press platform.
Data correspond to usage on the plateform after 2015. The current usage metrics is available 48-96 hours after online publication and is updated daily on week days.
Initial download of the metrics may take a while.