Fig. 9
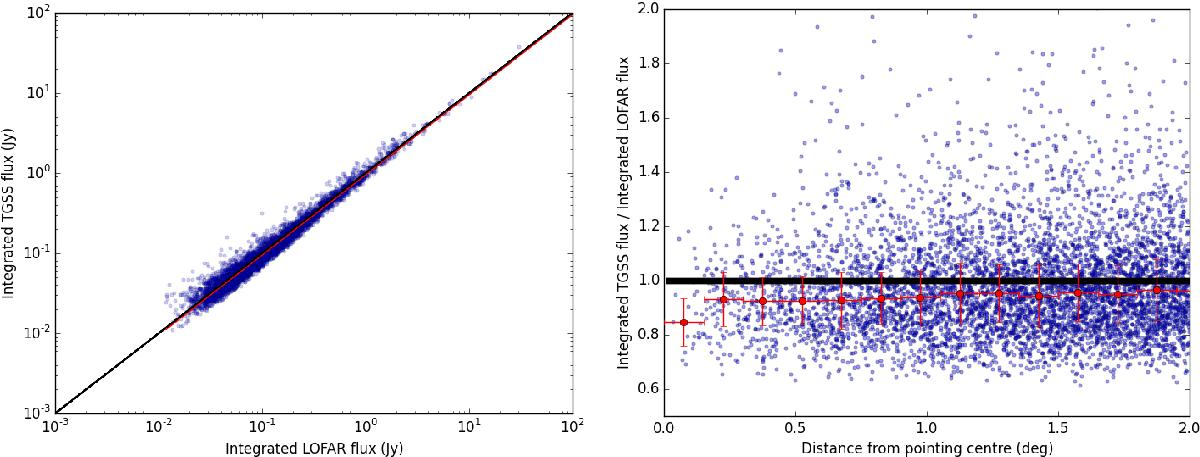
Comparison between the LOFAR integrated flux density measurements and the TGSS measurements with each cross-matched isolated compact source shown with a solid circle. Left panel: comparison of the integrated flux densities. The solid black lines show a 1:1 ratio of the integrated flux densities and the solid red line shows the median ratio between the integrated flux density measurements. Right panel: comparison of the integrated flux density ratio as a function of distance from the LOFAR pointing centre. The red symbols indicate the median within bins of distance, with the vertical error bars showing the median absolute deviation (MAD) value for each bin and the horizontal error bars giving the bin width. The median value of the TGSS integrated flux density divided by the LOFAR integrated flux density is 0.95.
Current usage metrics show cumulative count of Article Views (full-text article views including HTML views, PDF and ePub downloads, according to the available data) and Abstracts Views on Vision4Press platform.
Data correspond to usage on the plateform after 2015. The current usage metrics is available 48-96 hours after online publication and is updated daily on week days.
Initial download of the metrics may take a while.