Fig. 7
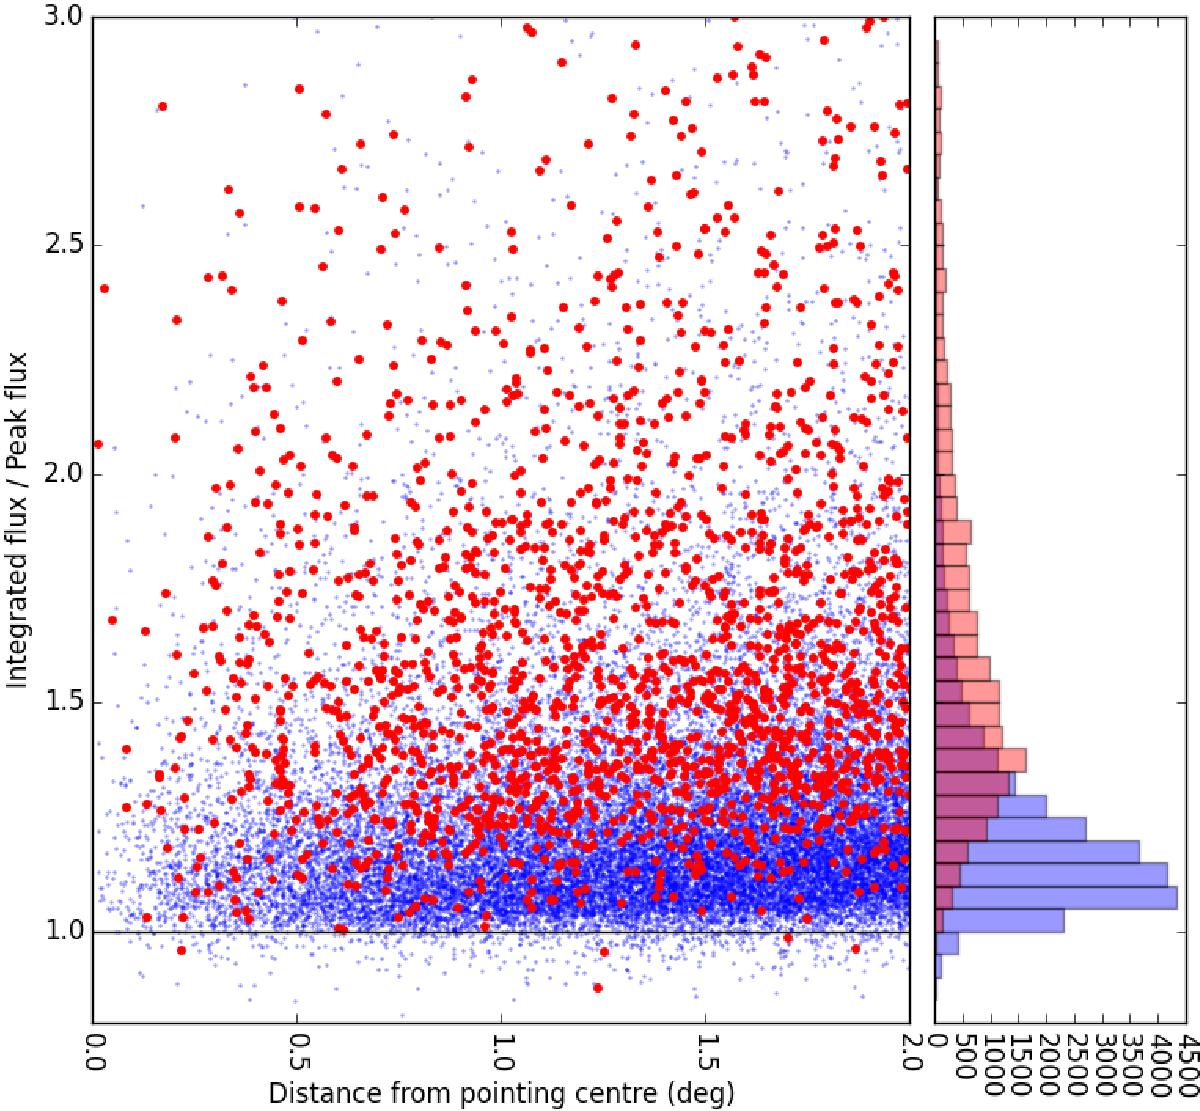
Ratio of the integrated flux density to peak brightness for compact sources in all 54 LOFAR pointings. The seven pointings identified as having particularly poor ionospheric conditions are shown in red and the remaining 54 pointings are shown in blue. The histogram of the red points has been multiplied by a factor of 10 for display purposes.
Current usage metrics show cumulative count of Article Views (full-text article views including HTML views, PDF and ePub downloads, according to the available data) and Abstracts Views on Vision4Press platform.
Data correspond to usage on the plateform after 2015. The current usage metrics is available 48-96 hours after online publication and is updated daily on week days.
Initial download of the metrics may take a while.