Fig. 3
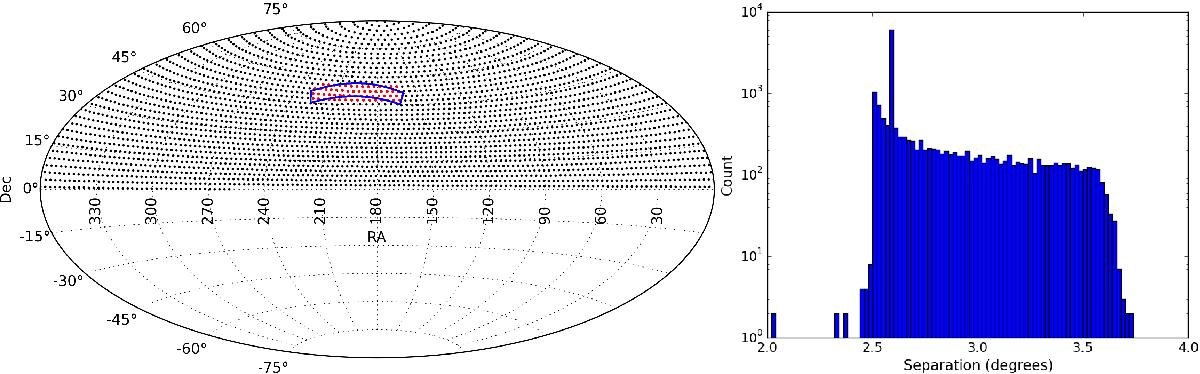
Left panel: LoTSS pointing grid, which follows a spherical spiral structure. The region highlighted in blue is the HETDEX Spring Field. The red points show the LOFAR pointings that are presented in this publication and the black points show the rest of the survey grid. Right panel: histogram of the separation of the six nearest neighbours to each of the 3170 pointings in the survey grid excluding the edge pointings close to declination zero. A log scale is used on the y-axis to clearly show the full variation of pointing separations. The mean separation of pointings is 2.80° but the distribution is highly peaked around the median separation of 2.58°. In total, 65% of pointings have all six nearest neighbours within 2.80° and 98% have at least four neighbouring pointings within 2.80°. The right panel was created from a grid with a complete spherical spiral structure and ignores the 42 test pointings that were conducted with a slightly different tiling strategy.
Current usage metrics show cumulative count of Article Views (full-text article views including HTML views, PDF and ePub downloads, according to the available data) and Abstracts Views on Vision4Press platform.
Data correspond to usage on the plateform after 2015. The current usage metrics is available 48-96 hours after online publication and is updated daily on week days.
Initial download of the metrics may take a while.