Fig. 12
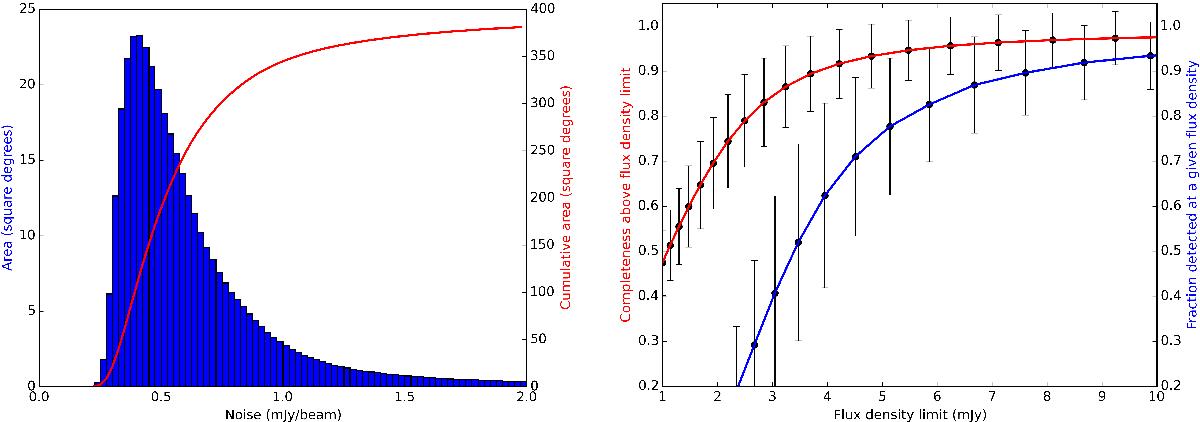
Left: estimated noise variations on the direction-independent calibrated mosaicked images within the 381 square degree region encompassed by the FWHM of the mosaicked pointings. The red line shows the cumulative area of the mosaicked region that has a estimated noise less than a given value. The histogram shows the distribution of noise estimates within the mosaicked region. Right: estimated cumulative completeness of the preliminary data release catalogue (red) and the fraction of simulated sources that are detected as a function of flux density (blue). A large number of sources were injected during the completeness simulations and, as a consequence, the Poissonian errors are negligible. However, the spatial variation in noise is substantial and the error bars show the standard deviation of the measurements as a function of position.
Current usage metrics show cumulative count of Article Views (full-text article views including HTML views, PDF and ePub downloads, according to the available data) and Abstracts Views on Vision4Press platform.
Data correspond to usage on the plateform after 2015. The current usage metrics is available 48-96 hours after online publication and is updated daily on week days.
Initial download of the metrics may take a while.