Fig. 11
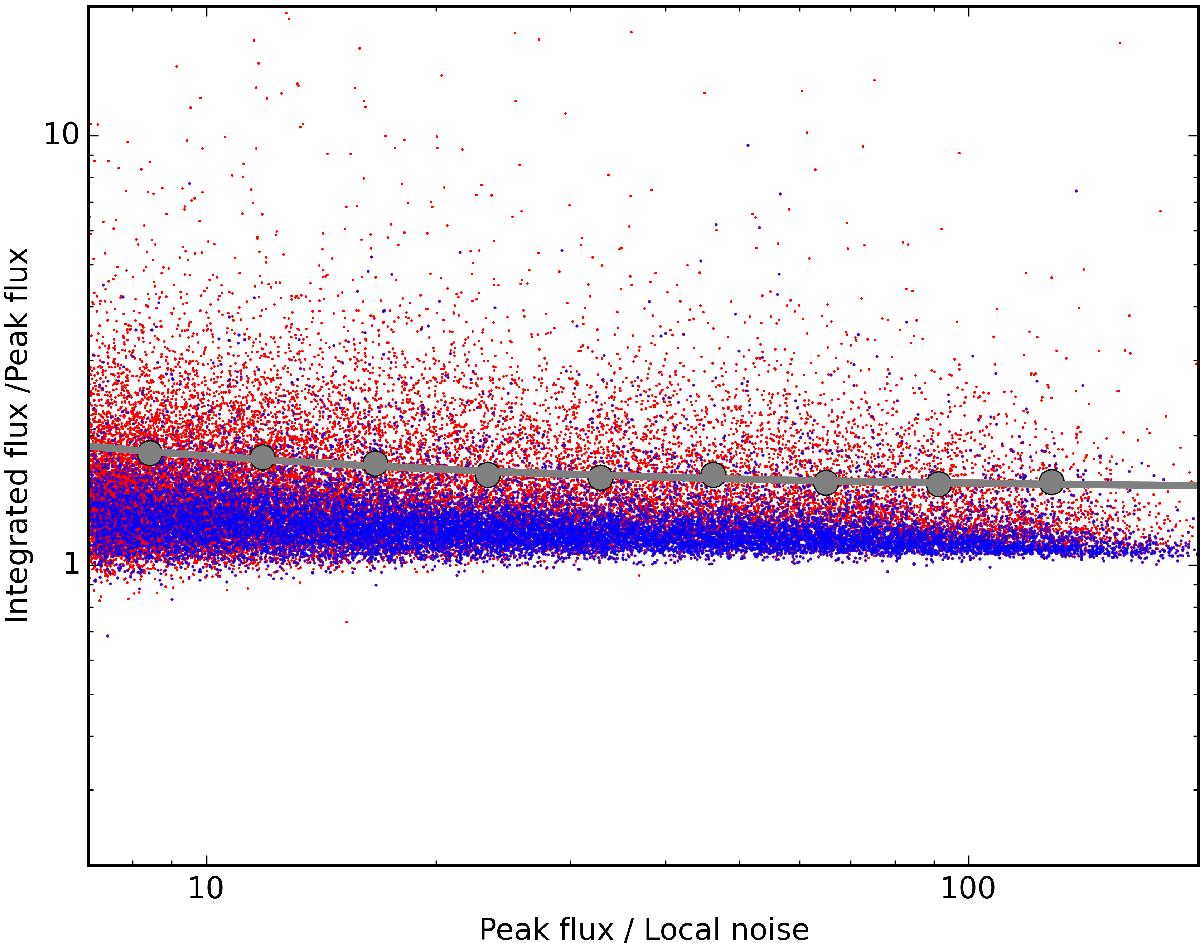
Ratio of the integrated flux density to peak brightness for sources in the preliminary data release catalogue as a function of the signal-to-noise ratio. Sources with a size of less than 5″ in the FIRST catalogue are shown in blue and all other sources are shown in red. The large dots indicate the boundary that contains 95% of the compact FIRST detected sources and the line shows the best fit to this boundary, which is given by ![]() .
.
Current usage metrics show cumulative count of Article Views (full-text article views including HTML views, PDF and ePub downloads, according to the available data) and Abstracts Views on Vision4Press platform.
Data correspond to usage on the plateform after 2015. The current usage metrics is available 48-96 hours after online publication and is updated daily on week days.
Initial download of the metrics may take a while.