Fig. 1
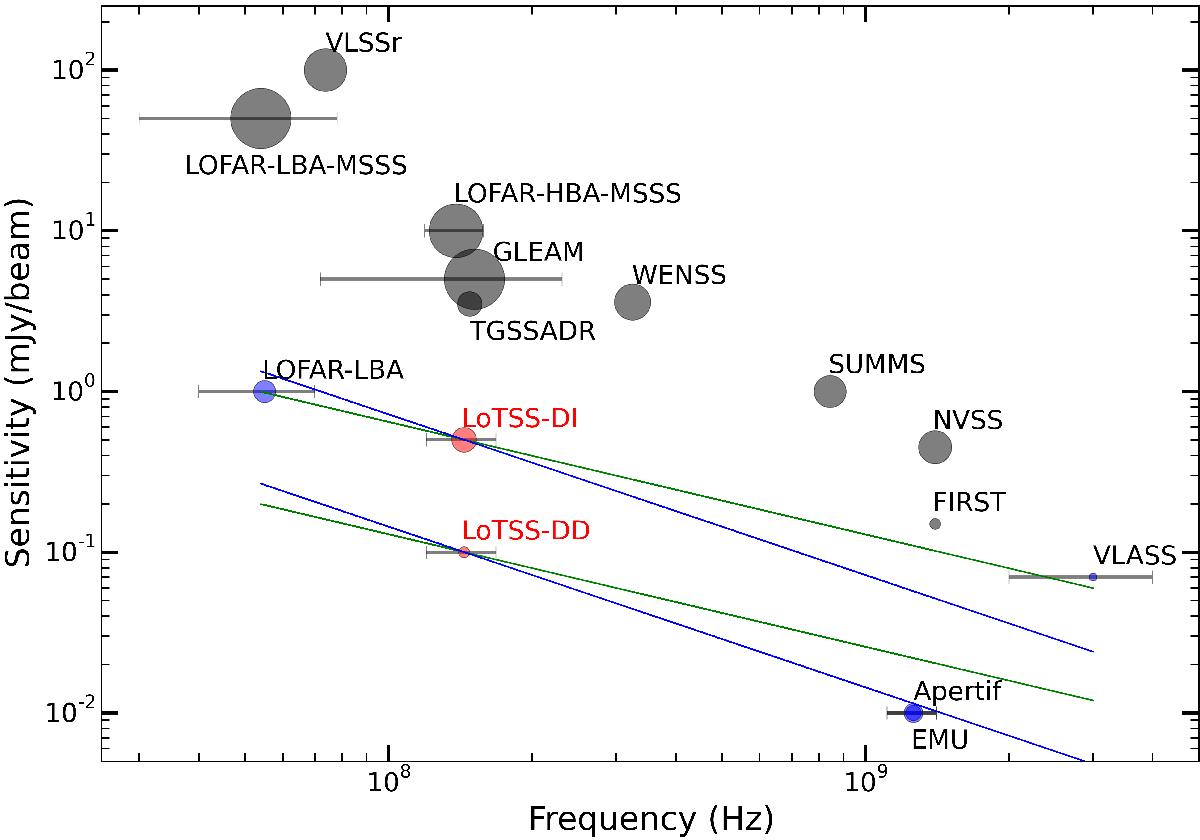
Summary of the sensitivity, frequency, and resolution of a selection of recent and planned large-area radio surveys (see also Table 1). The size of the markers is proportional to the square root of the survey resolution. Grey, blue, and red markers show the ongoing/completed surveys, forthcoming surveys, and the LOFAR HBA surveys, respectively. The horizontal lines show the frequency coverage for surveys with large fractional bandwidths (>0.2). The green sloping lines show the sensitivity that is equivalent to that achieved in the LoTSS direction-dependent (DD) calibrated and direction-independent (DI) images for typical radio sources with a spectral index ~−0.7. Similarly, the blue sloping lines show the equivalent sensitivity to steep spectrum sources with a spectral index ~−1.0.
Current usage metrics show cumulative count of Article Views (full-text article views including HTML views, PDF and ePub downloads, according to the available data) and Abstracts Views on Vision4Press platform.
Data correspond to usage on the plateform after 2015. The current usage metrics is available 48-96 hours after online publication and is updated daily on week days.
Initial download of the metrics may take a while.