Fig. 7
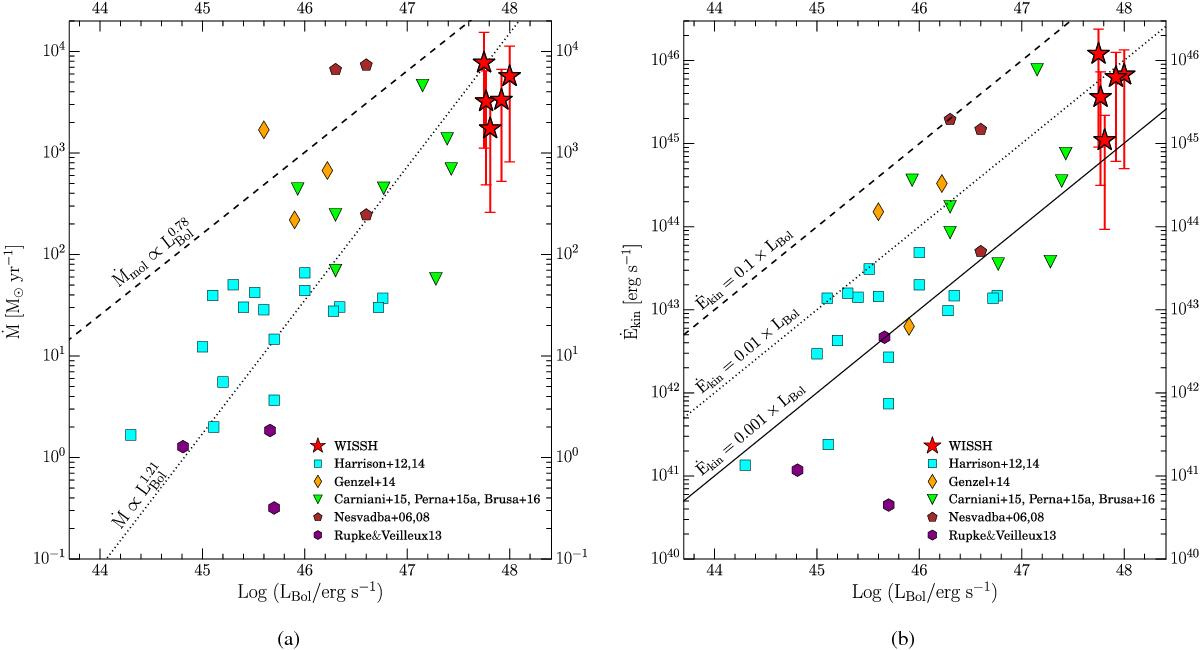
Mass rate a) and kinetic power b) of the ionised outflows as a function of LBol. Values obtained for the WISSH quasars (red stars) are compared with other samples from literature (i.e. Harrison et al. 2012, 2014; Genzel et al. 2014; Carniani et al. 2015; Perna et al. 2015a; Brusa et al. 2016; Nesvadba et al. 2006, 2008; Rupke & Veilleux 2013). Error bars are calculated as described in Sect. 6.2. In panel a) the dotted line corresponds to the best-fit relation ![]() derived for ionised outflows and the dashed line indicates the
derived for ionised outflows and the dashed line indicates the ![]() best-fit relation to molecular outflows (see Fiore et al. 2016, for a complete discussion). In panel b) dashed, dotted, and solid lines represent an outflow kinetic power that is 10%, 1%, and 0.1% of the AGN luminosity, respectively.
best-fit relation to molecular outflows (see Fiore et al. 2016, for a complete discussion). In panel b) dashed, dotted, and solid lines represent an outflow kinetic power that is 10%, 1%, and 0.1% of the AGN luminosity, respectively.
Current usage metrics show cumulative count of Article Views (full-text article views including HTML views, PDF and ePub downloads, according to the available data) and Abstracts Views on Vision4Press platform.
Data correspond to usage on the plateform after 2015. The current usage metrics is available 48-96 hours after online publication and is updated daily on week days.
Initial download of the metrics may take a while.