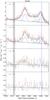
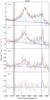
Fig. 2
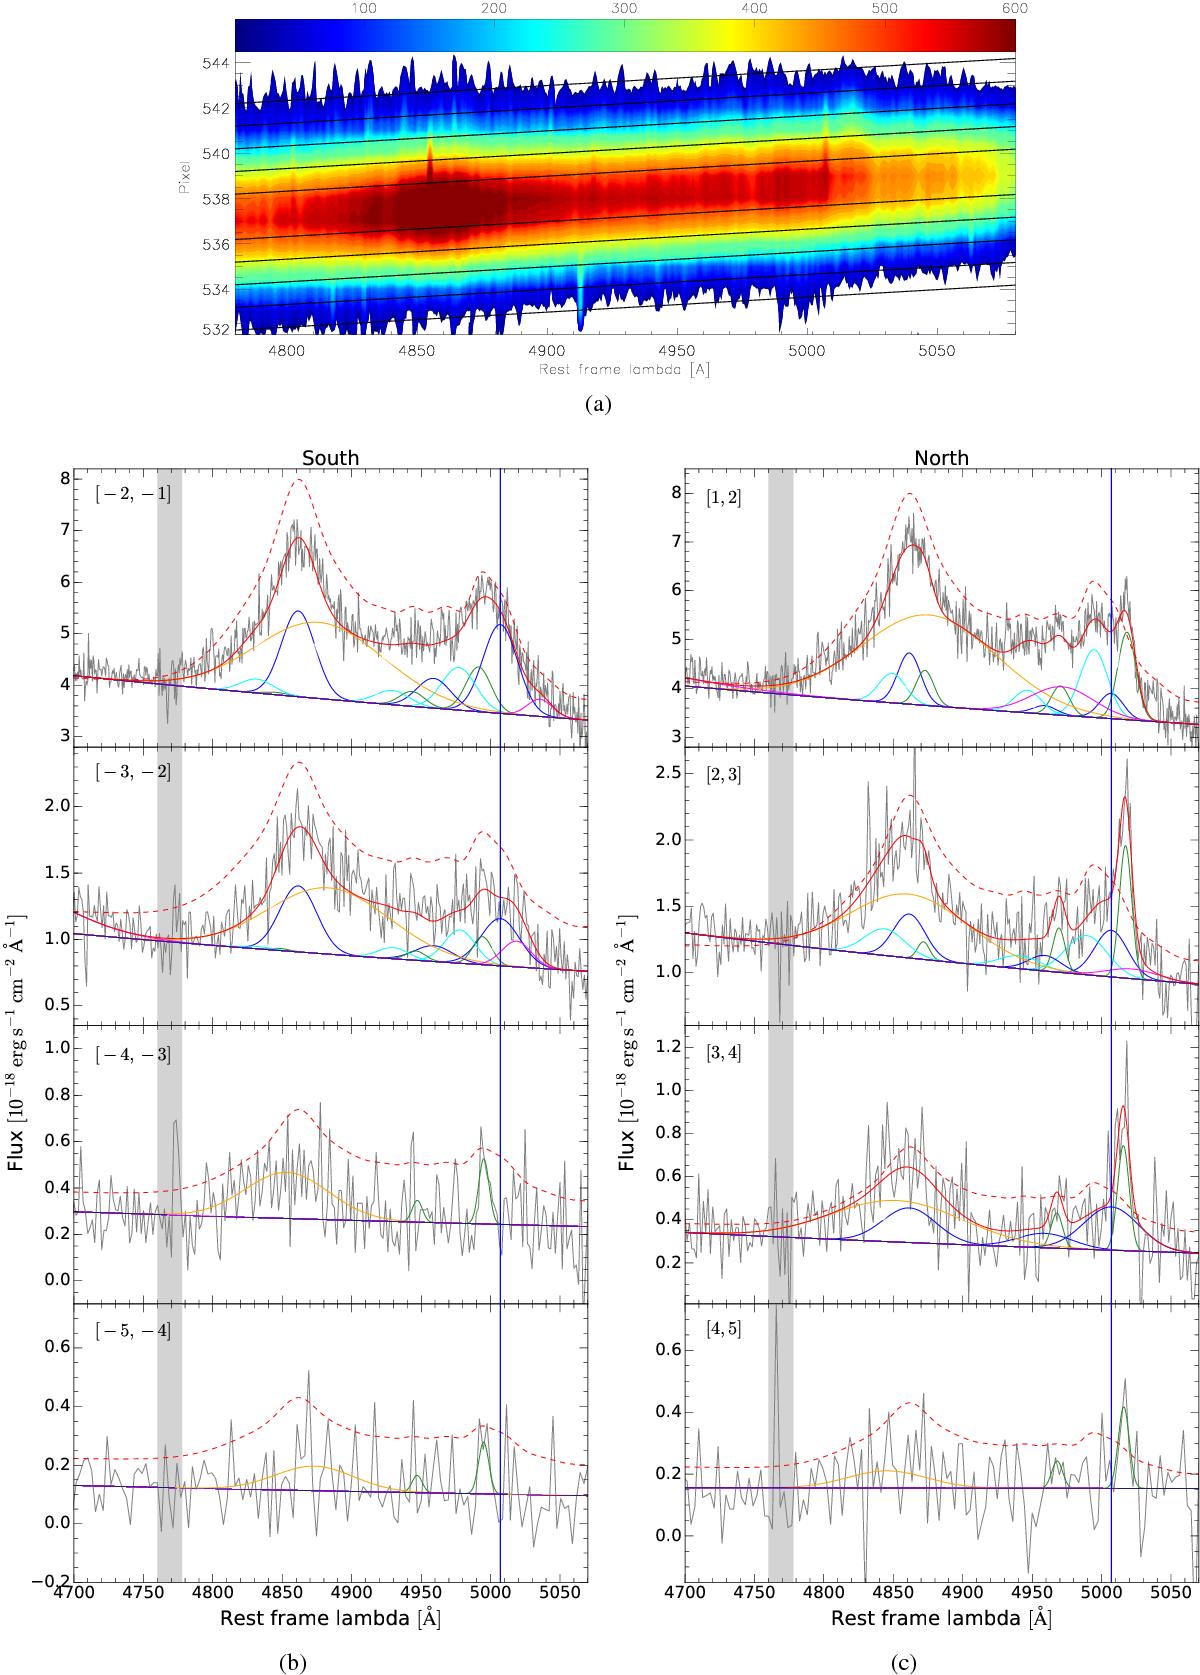
a) 2D LUCI1 spectrum of J1201+1206. Blue to red colours indicate increasing counts. Since the LUCI1 spectra were acquired with PA = 0 deg, the top and bottom correspond to north and south directions, respectively. The black solid lines indicate the apertures used for extracting the off-nuclear spectra. Panels b) and c) show the “off-nuclear” spectra of J1201+1206 extracted in 1 pixel (~1.9 kpc) width regions at increasing distances from the peak of the spatial profile of the continuum emission. Negative (positive) pixel values correspond to south (north) direction. In both panels, the offset increases from top to bottom, as indicated by the corresponding pixels interval. Spectral components are indicated as in Fig. 1c. The vertical line corresponds to λ = 5007 Å, while the dashed red line indicates the best-fit model of the central spectrum extracted from the two-pixels region [−1, 1], plotted with arbitrary normalisation for display purpose only. Grey bands indicate the regions excluded from the fit because of the presence of telluric features.
Current usage metrics show cumulative count of Article Views (full-text article views including HTML views, PDF and ePub downloads, according to the available data) and Abstracts Views on Vision4Press platform.
Data correspond to usage on the plateform after 2015. The current usage metrics is available 48-96 hours after online publication and is updated daily on week days.
Initial download of the metrics may take a while.