Fig. 1
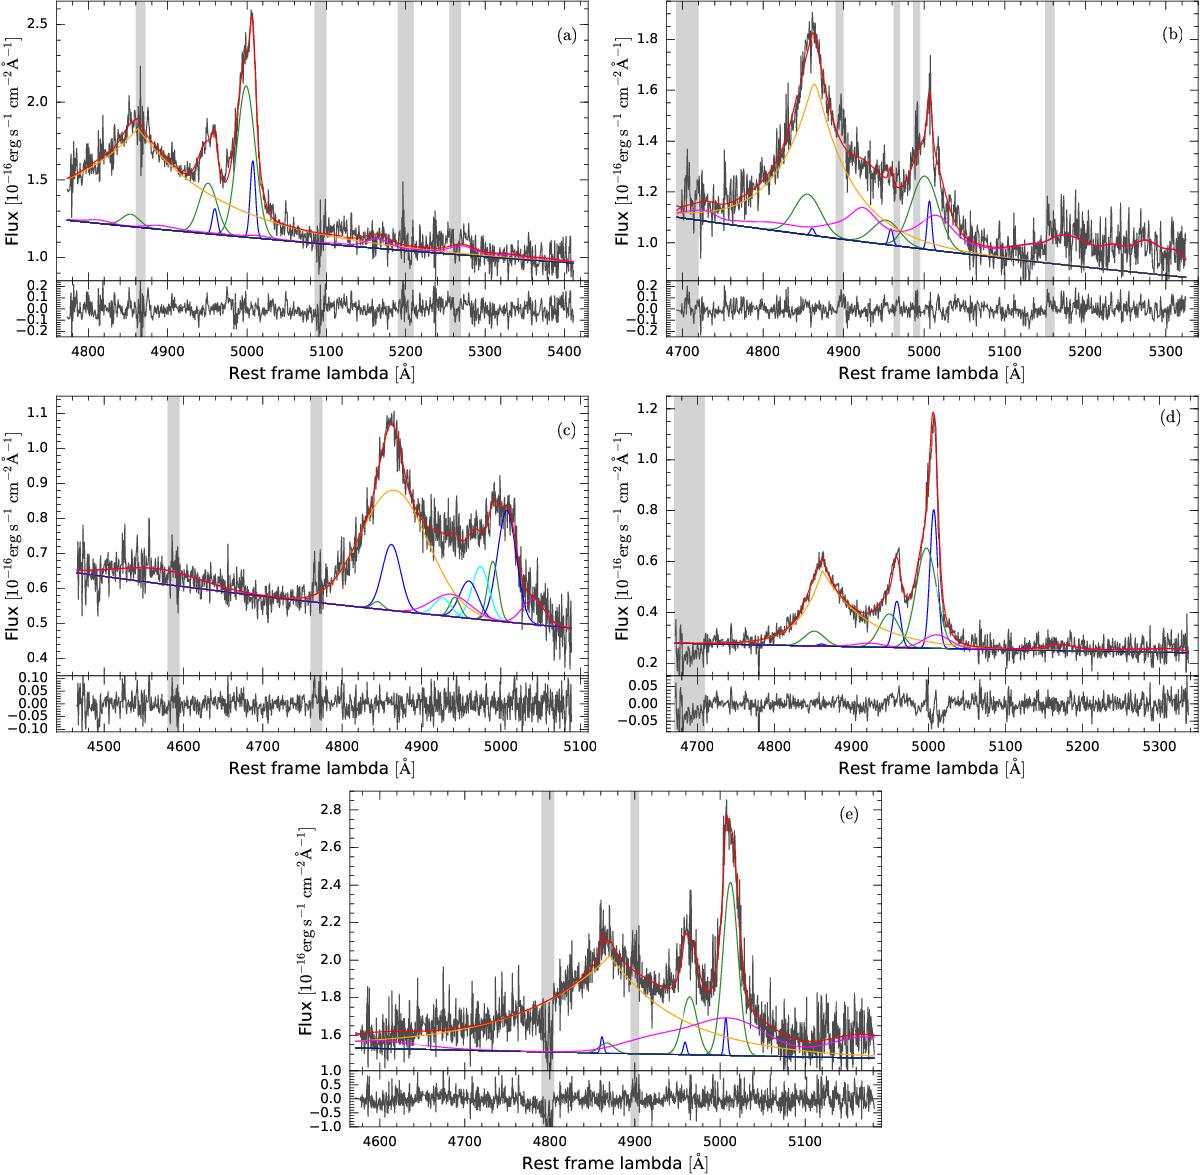
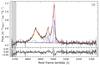
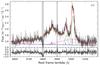
LUCI1 spectra of the five analysed WISSH quasars. The red lines show the resulting best fits for a) SDSS J0745+4734, b) J0900+4215, c) J1201+1206, d) J1326−0005, and e) J1549+1245. Blue and green curves refer to the NLR core and broad emission of both [OIII] and Hβ, respectively. BLR Hβ emission is indicated in orange and FeII emission is indicated in magenta. The cyan curve in panel c) represents the additional components necessary to account for the plateau-like emission feature between 4900–5000 Å in J1201+1206. Grey bands indicate the regions excluded from the fit because of the presence of telluric features.
Current usage metrics show cumulative count of Article Views (full-text article views including HTML views, PDF and ePub downloads, according to the available data) and Abstracts Views on Vision4Press platform.
Data correspond to usage on the plateform after 2015. The current usage metrics is available 48-96 hours after online publication and is updated daily on week days.
Initial download of the metrics may take a while.