Fig. 6
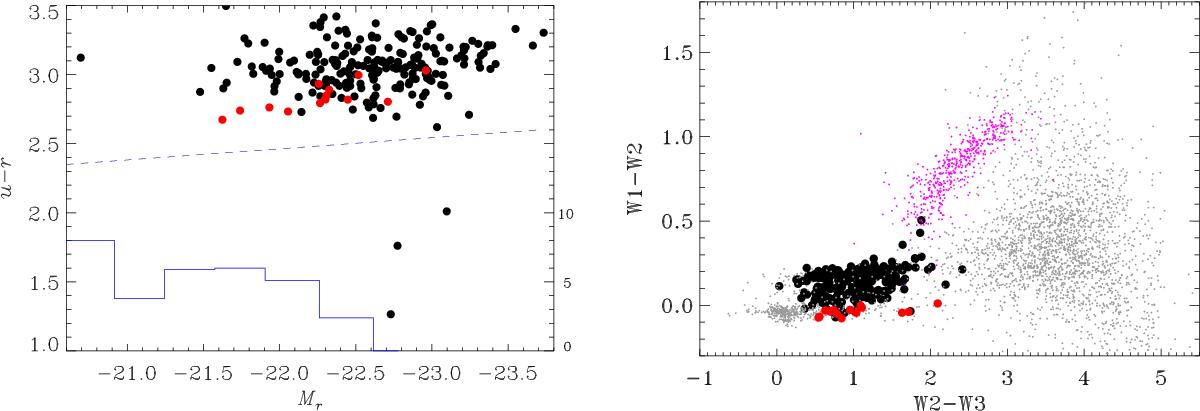
Left: absolute r band magnitude, Mr, vs. u−r color for the FRICAT hosts (the red dots represent the sFRICAT sample). The blue histogram on the bottom shows the percentage of blue ETGs (scale on the right axis) from Schawinski et al. (2009). The dashed line separates the “blue” ETG from the red sequence, following their definition. Right: WISE mid-IR colors of the FRICAT hosts compared to those of ~3000 randomly selected IR sources (gray dots) selected at high Galactic latitudes. We also show the region occupied by the Fermi blazars (purple dots).
Current usage metrics show cumulative count of Article Views (full-text article views including HTML views, PDF and ePub downloads, according to the available data) and Abstracts Views on Vision4Press platform.
Data correspond to usage on the plateform after 2015. The current usage metrics is available 48-96 hours after online publication and is updated daily on week days.
Initial download of the metrics may take a while.