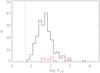
Fig. 3
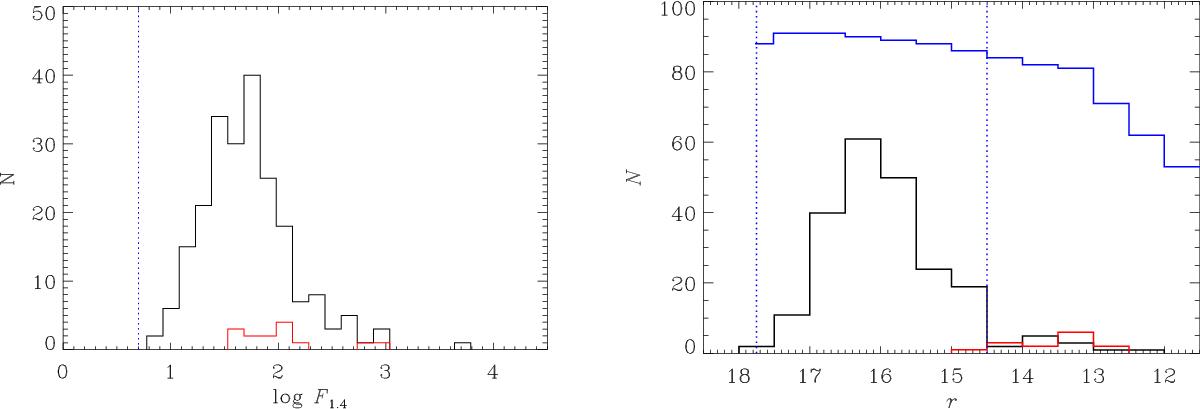
Left: distribution of the NVSS fluxes of the 219 FRICAT sources; the red histogram is for the 14 sFRICAT sources. The vertical blue dotted line indicates the 5 mJy limits of the BH12 sample. Right: the black curve shows the r-band magnitude distribution of the FRICAT hosts (the red histogram is for the sFRICAT sources); the vertical dotted lines indicate the limits defining the SDSS main galaxies sample. The blue histogram report the SDSS completeness in percentage from Montero-Dorta & Prada (2009).
Current usage metrics show cumulative count of Article Views (full-text article views including HTML views, PDF and ePub downloads, according to the available data) and Abstracts Views on Vision4Press platform.
Data correspond to usage on the plateform after 2015. The current usage metrics is available 48-96 hours after online publication and is updated daily on week days.
Initial download of the metrics may take a while.