Fig. 5
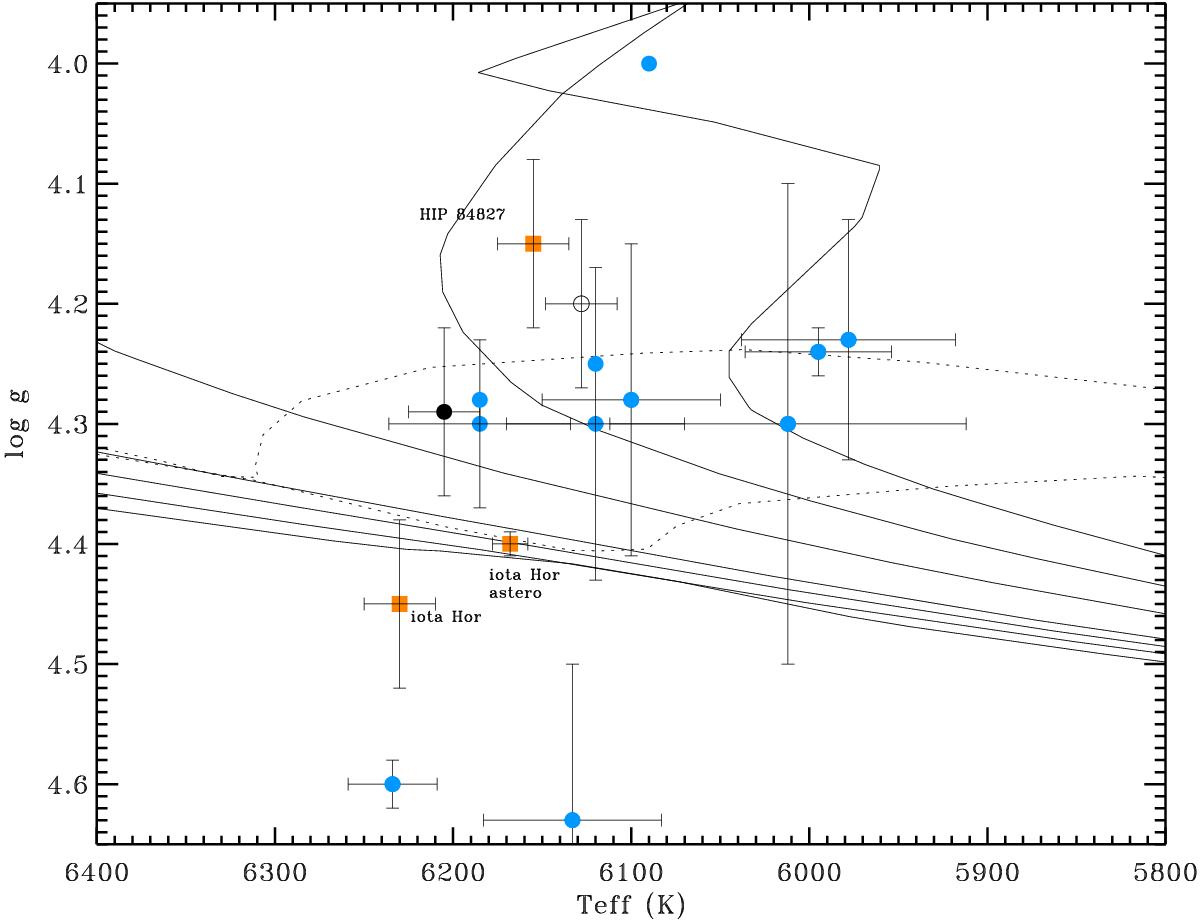
log g vs. Teff for GJ 504 as resulting from our spectroscopic analysis (filled black circle) and when applying the results of the spectroscopic differential analysis with respect to the asteroseismology value of ι Hor (empty circle). Overplotted are the 0.1, 0.4, 0.7, 1.0, 2.0, 3.0, and 4.0 Gyr isochrones (continuous lines) and the 20 and 25 Myr pre-main-sequence isochrones (dashed lines) for the appropriate metallicity from Bressan et al. (2012). Additional measurements of log g vs. Teff for GJ 504 from the literature are plotted as light blue filled circles. The parameters of ι Hor and HIP 84827 (our spectroscopic analysis and the parameters of iota Hor) as derived from the asteroseismology analysis (Vauclair et al. 2008) are plotted as empty red circles.
Current usage metrics show cumulative count of Article Views (full-text article views including HTML views, PDF and ePub downloads, according to the available data) and Abstracts Views on Vision4Press platform.
Data correspond to usage on the plateform after 2015. The current usage metrics is available 48-96 hours after online publication and is updated daily on week days.
Initial download of the metrics may take a while.