Fig. 9
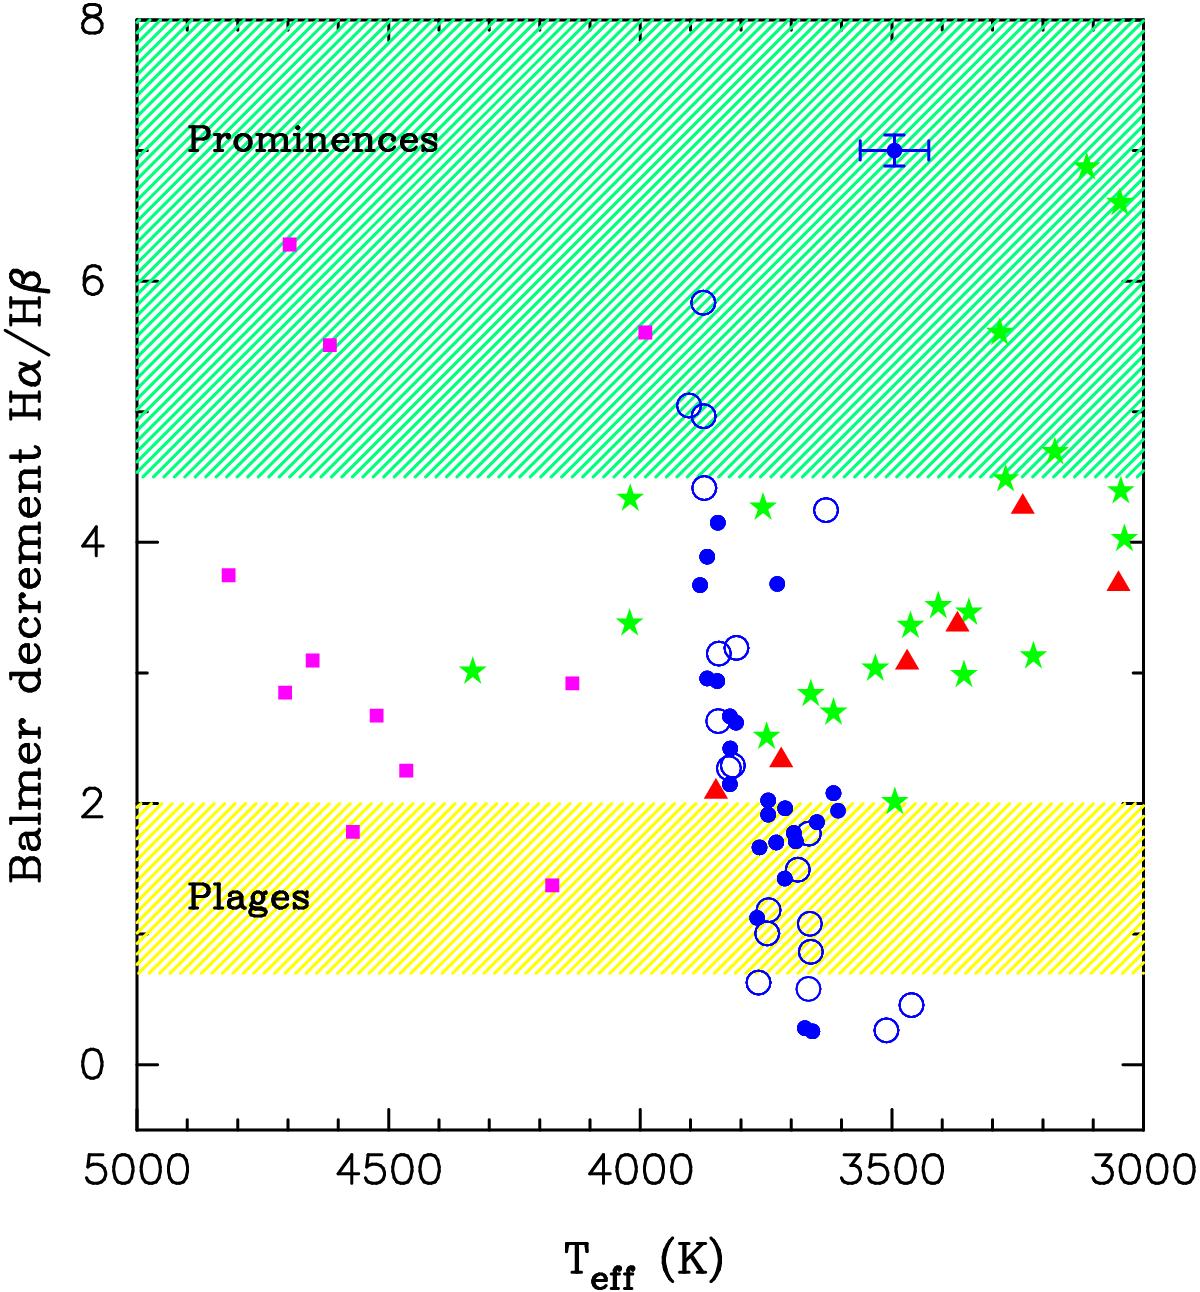
Balmer decrement FHα/FHβ vs. the effective temperature. Possible young stars are shown with filled symbols. Green stars denote pre-MS M stars from Stelzer et al. (2013a), red triangles correspond to the active M dwarf templates from the Sloan Digital Sky Survey (Bochanski et al. 2007), while data from Frasca et al. (2015) is shown in purple squares. Typical ranges of solar plages and prominences are shown as hatched areas. Typical uncertainties are also shown.
Current usage metrics show cumulative count of Article Views (full-text article views including HTML views, PDF and ePub downloads, according to the available data) and Abstracts Views on Vision4Press platform.
Data correspond to usage on the plateform after 2015. The current usage metrics is available 48-96 hours after online publication and is updated daily on week days.
Initial download of the metrics may take a while.