Free Access
Fig. 6
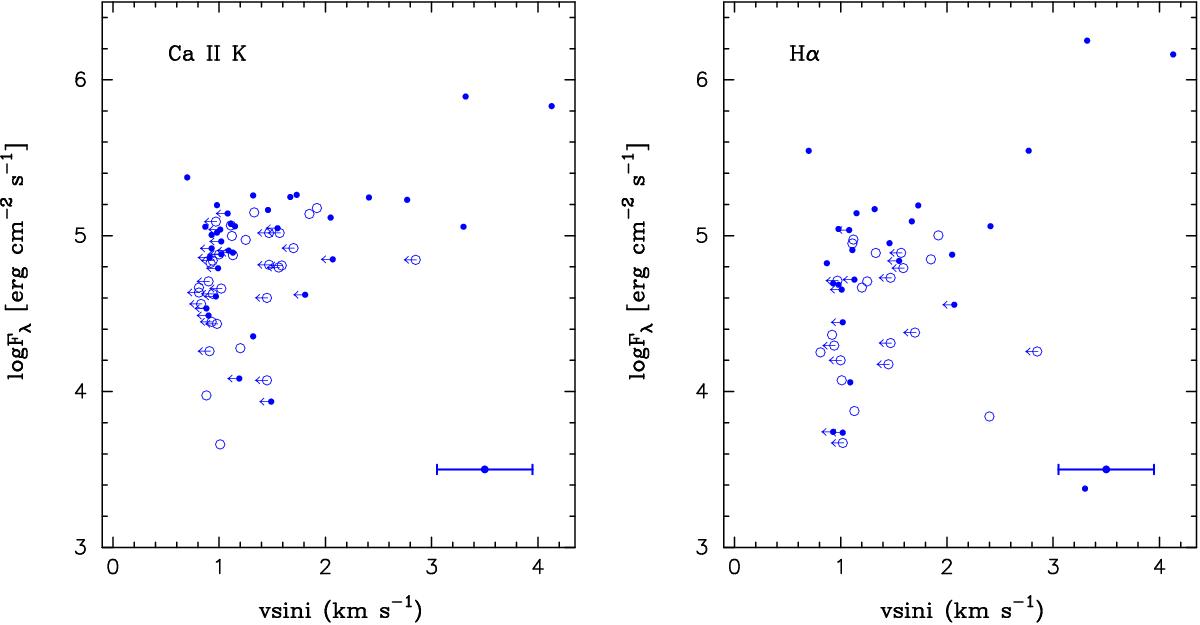
Ca ii K (left) and Hα (right) line emission excess flux vs. vsini. Possible young stars according to our kinematic analysis are shown with filled symbols. Upper limits on vsini are shown with arrows, while the typical error bar is shown in the lower right corner.
This figure is made of several images, please see below:
Current usage metrics show cumulative count of Article Views (full-text article views including HTML views, PDF and ePub downloads, according to the available data) and Abstracts Views on Vision4Press platform.
Data correspond to usage on the plateform after 2015. The current usage metrics is available 48-96 hours after online publication and is updated daily on week days.
Initial download of the metrics may take a while.