Free Access
Fig. 5
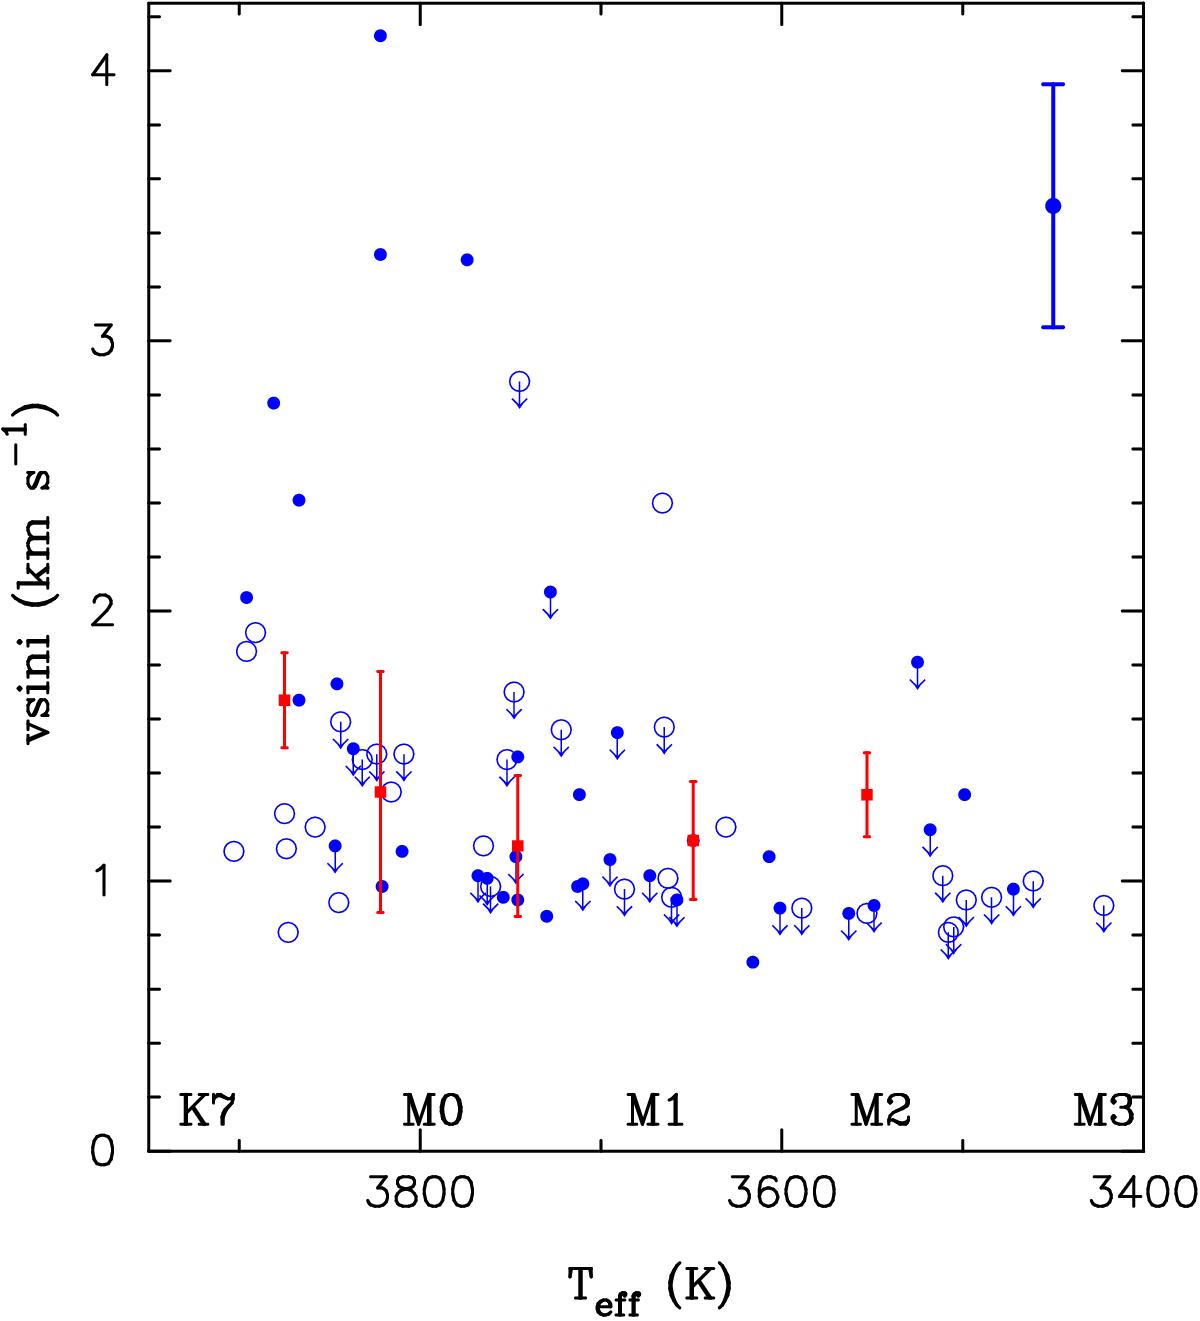
Values of vsini vs. the effective temperature. Upper limits on vsini are shown with arrows. Possible young stars are shown with filled symbols. Typical uncertainties are also shown. Median binned values (without considering upper limits) are overplotted as red squares.
Current usage metrics show cumulative count of Article Views (full-text article views including HTML views, PDF and ePub downloads, according to the available data) and Abstracts Views on Vision4Press platform.
Data correspond to usage on the plateform after 2015. The current usage metrics is available 48-96 hours after online publication and is updated daily on week days.
Initial download of the metrics may take a while.