Free Access
Fig. 3
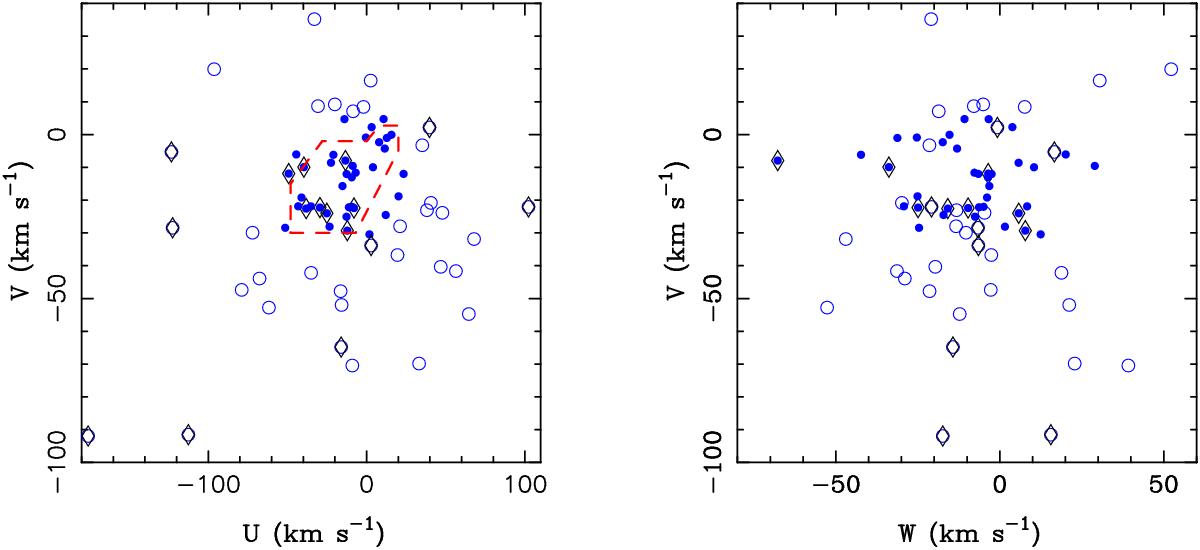
(U,V) and (W,V) planes for the observed stars. The dashed red line represents the boundary of the young disc population as defined by Eggen (1984, 1989). Stars inside or close to this boundary are shown with filled circles. Stars flagged as binaries are shown with diamonds.
Current usage metrics show cumulative count of Article Views (full-text article views including HTML views, PDF and ePub downloads, according to the available data) and Abstracts Views on Vision4Press platform.
Data correspond to usage on the plateform after 2015. The current usage metrics is available 48-96 hours after online publication and is updated daily on week days.
Initial download of the metrics may take a while.