Fig. 10
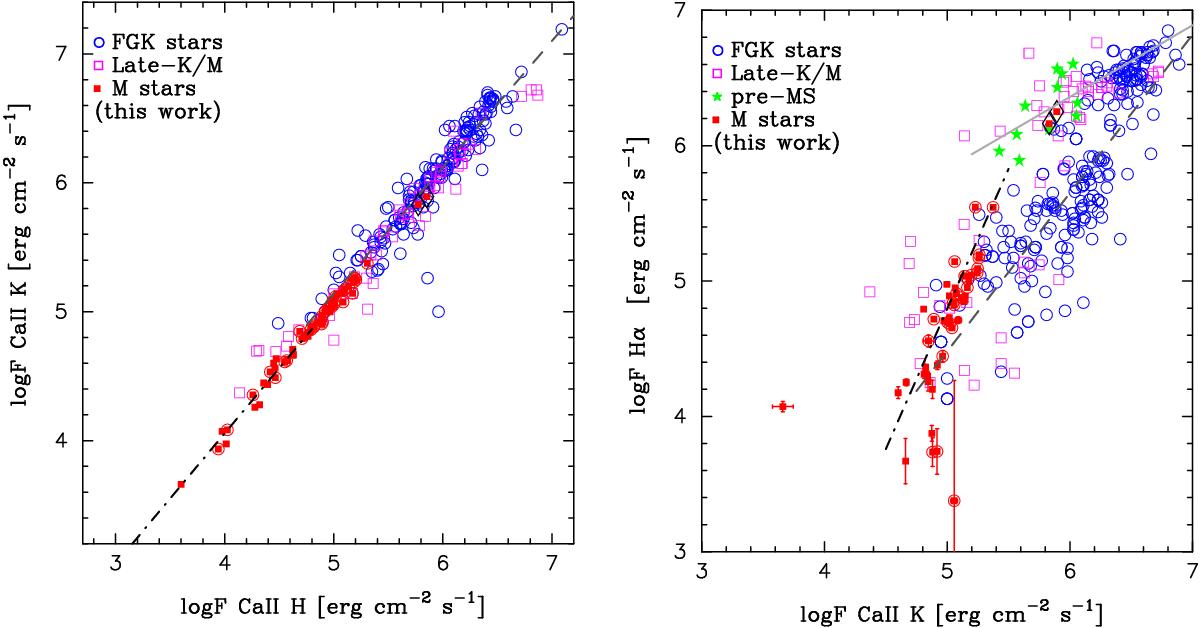
Flux-flux relationships between calcium lines (Ca ii H & K, left panel), and between Hα and Ca ii K (right panel). M dwarfs from this work are plotted with red filled squares; FGK stars from López-Santiago et al. (2010), Martínez-Arnáiz et al. (2010, 2011) with open circles, late-K and M stars from the literature (same references as for FGK stars) are shown by purple open squares; green stars denote the M0-M3 pre-MS M stars from Stelzer et al. (2013a). Possible young disc stars in our M star sample are shown by circles. The two stars discussed in Sect. 6.5 are indicated by diamonds. The black dash-dotted line represents our best fit; the relations for the “active” and “inactive” branches by Martínez-Arnáiz et al. (2011) are shown in light grey solid and dashed dark grey lines, respectively.

Current usage metrics show cumulative count of Article Views (full-text article views including HTML views, PDF and ePub downloads, according to the available data) and Abstracts Views on Vision4Press platform.
Data correspond to usage on the plateform after 2015. The current usage metrics is available 48-96 hours after online publication and is updated daily on week days.
Initial download of the metrics may take a while.