Fig. 1
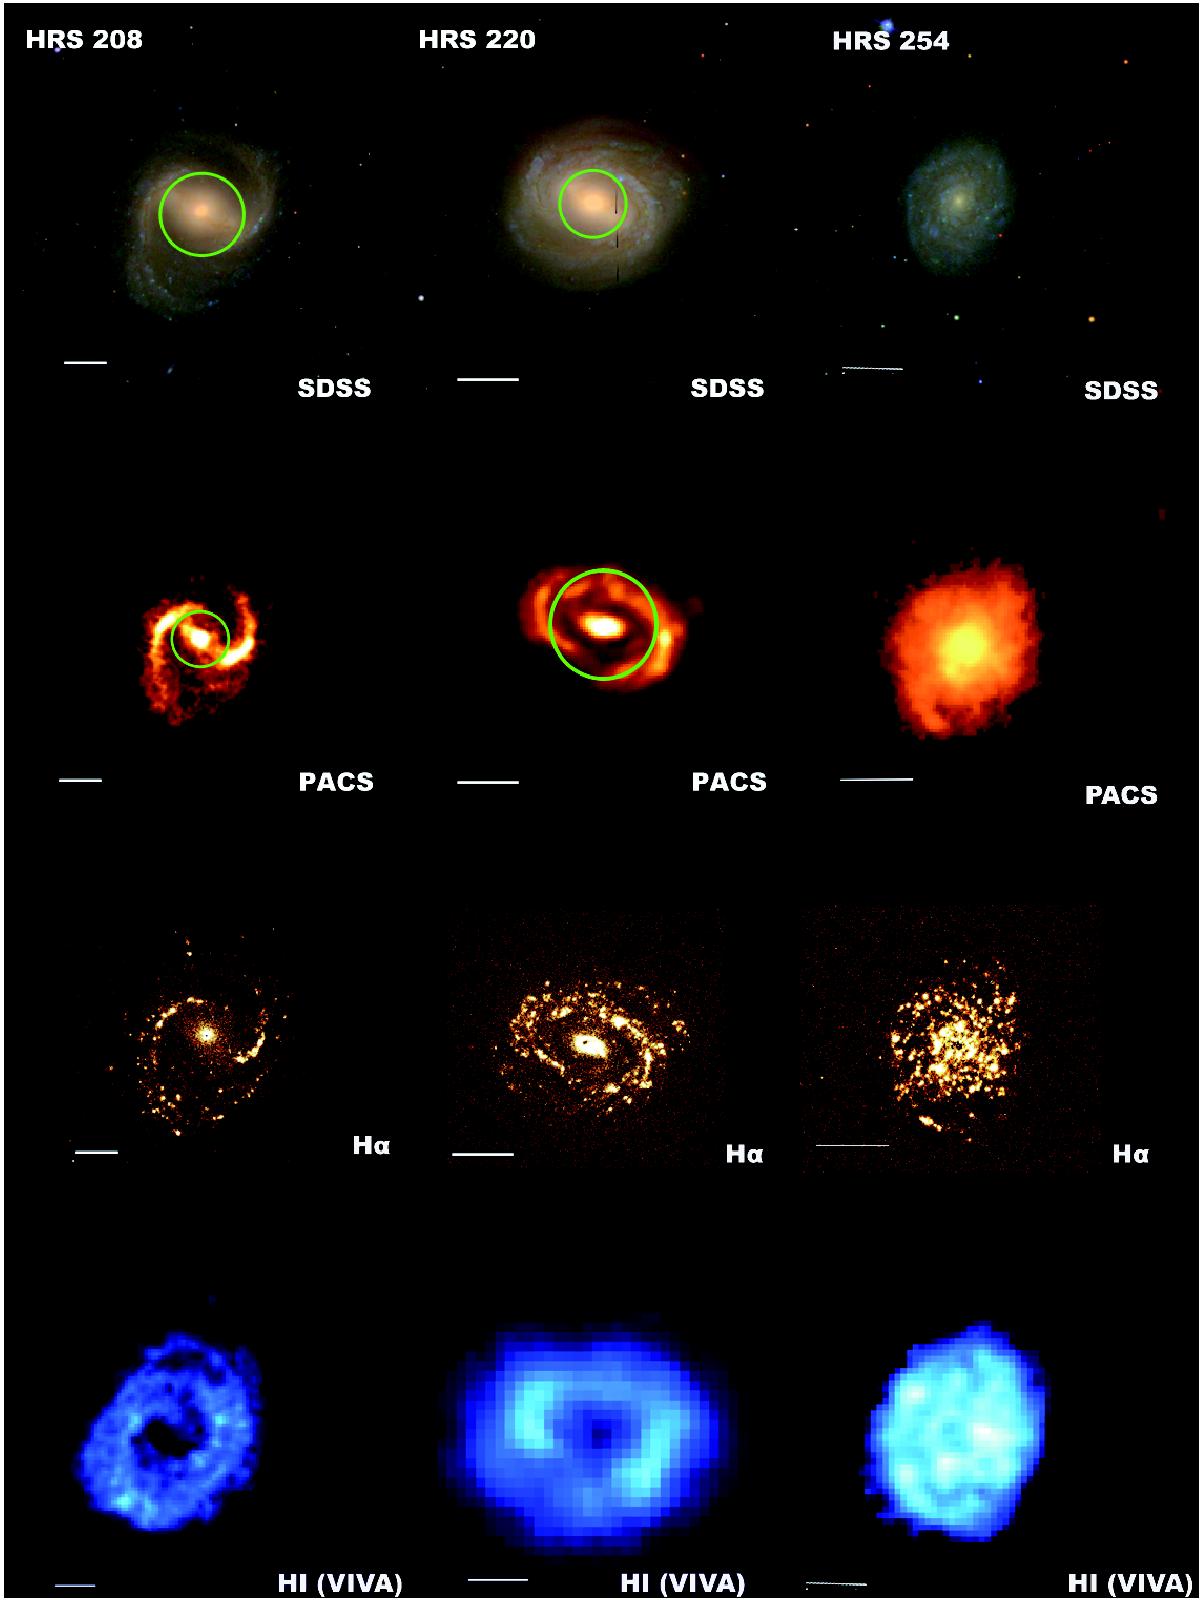
Examples for the categories classified in this work. From left to right: NGC 4548 (HRS-208), NGC 4579 (HRS-220), and NGC 4689 (HRS-256). The top row shows the SDSS RGB image of the galaxy while the second row shows the corresponding PACS images. The green circles qualitatively illustrate the circular region used to measure the extensions of structures. The Hα image is reported in the third row and the HI map from the VIVA survey is reported in the fourth row. In each frame a 1 arcminute scale is given.
Current usage metrics show cumulative count of Article Views (full-text article views including HTML views, PDF and ePub downloads, according to the available data) and Abstracts Views on Vision4Press platform.
Data correspond to usage on the plateform after 2015. The current usage metrics is available 48-96 hours after online publication and is updated daily on week days.
Initial download of the metrics may take a while.