Fig. 9
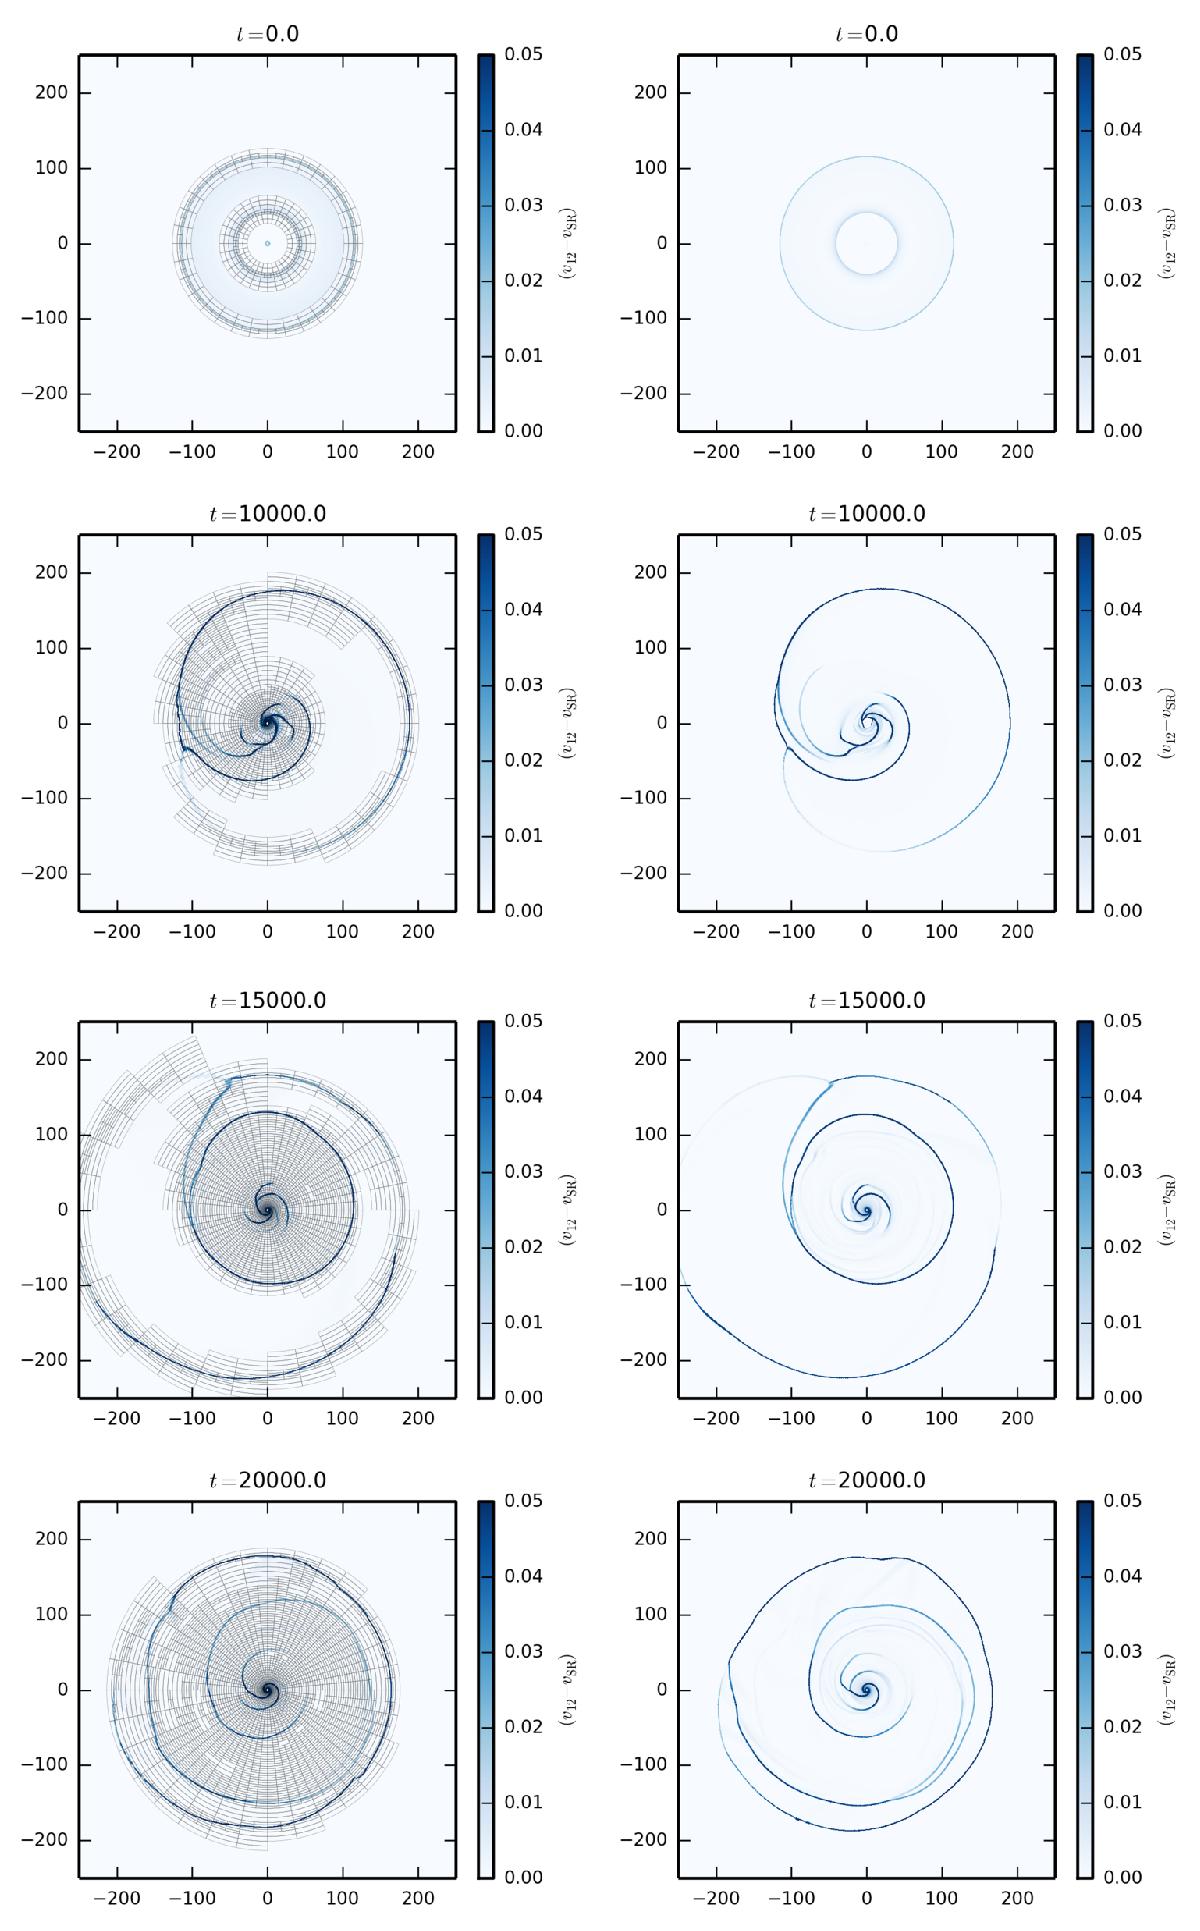
Evolution of the shock structure in the 2D recoiling black hole simulations at times 0, 10 000, 15 000 and 20 000 M, with three AMR levels and tolerance εt = 0.1 (left column) and a high resolution uniform grid (1024 × 512, right column). The colour indicates the difference between the relative velocity of the sides of the Riemann problem and the threshold velocity for producing a shock. For the AMR simulation, the blocks at levels higher than 1 are shown.
Current usage metrics show cumulative count of Article Views (full-text article views including HTML views, PDF and ePub downloads, according to the available data) and Abstracts Views on Vision4Press platform.
Data correspond to usage on the plateform after 2015. The current usage metrics is available 48-96 hours after online publication and is updated daily on week days.
Initial download of the metrics may take a while.