Fig. 15
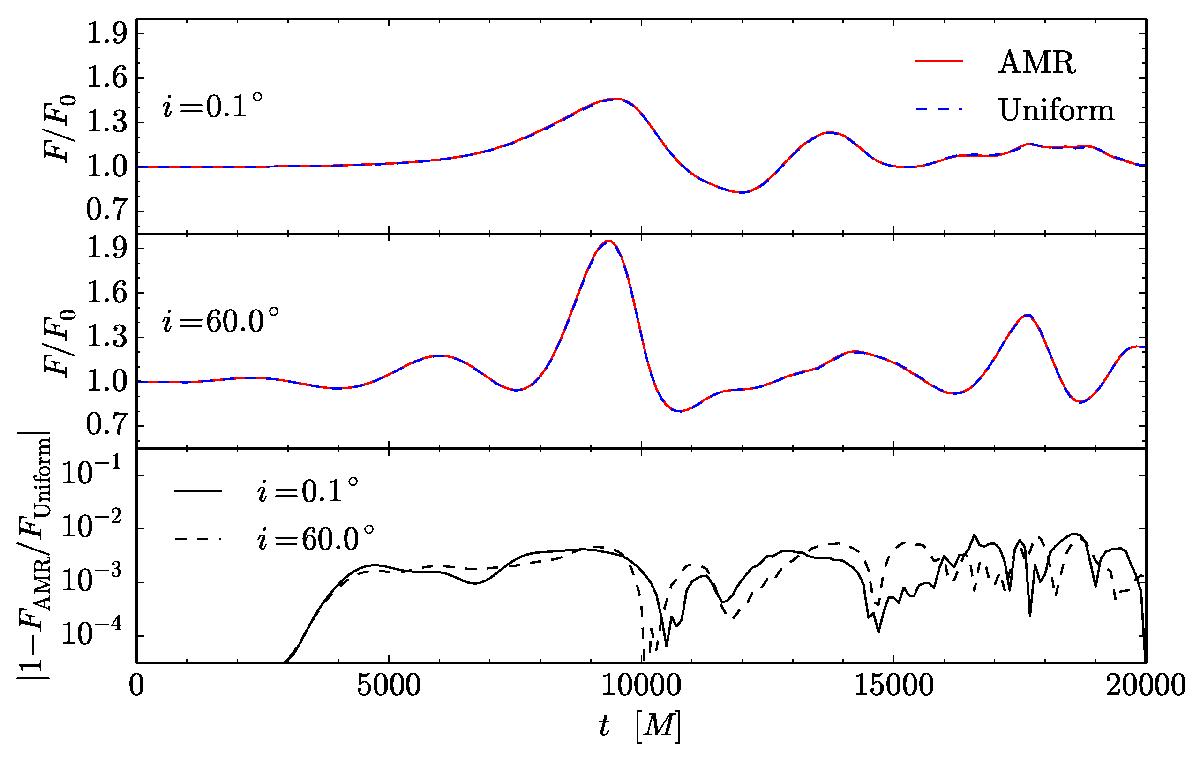
Top and middle panels: normalised total flux light curves of the emission from the 2D recoiling black hole simulation for θobs = 0.1° and θobs = 60°, respectively. Solid lines are for the simulation run with three AMR levels and a tolerance of εt = 0.005. Dashed lines are for the uniform grid simulation run of equivalent resolution. Bottom: flux difference between the 2D AMR and uniform run light-curves for θobs = 0.1° (solid) and θobs = 60° (dashed).
Current usage metrics show cumulative count of Article Views (full-text article views including HTML views, PDF and ePub downloads, according to the available data) and Abstracts Views on Vision4Press platform.
Data correspond to usage on the plateform after 2015. The current usage metrics is available 48-96 hours after online publication and is updated daily on week days.
Initial download of the metrics may take a while.