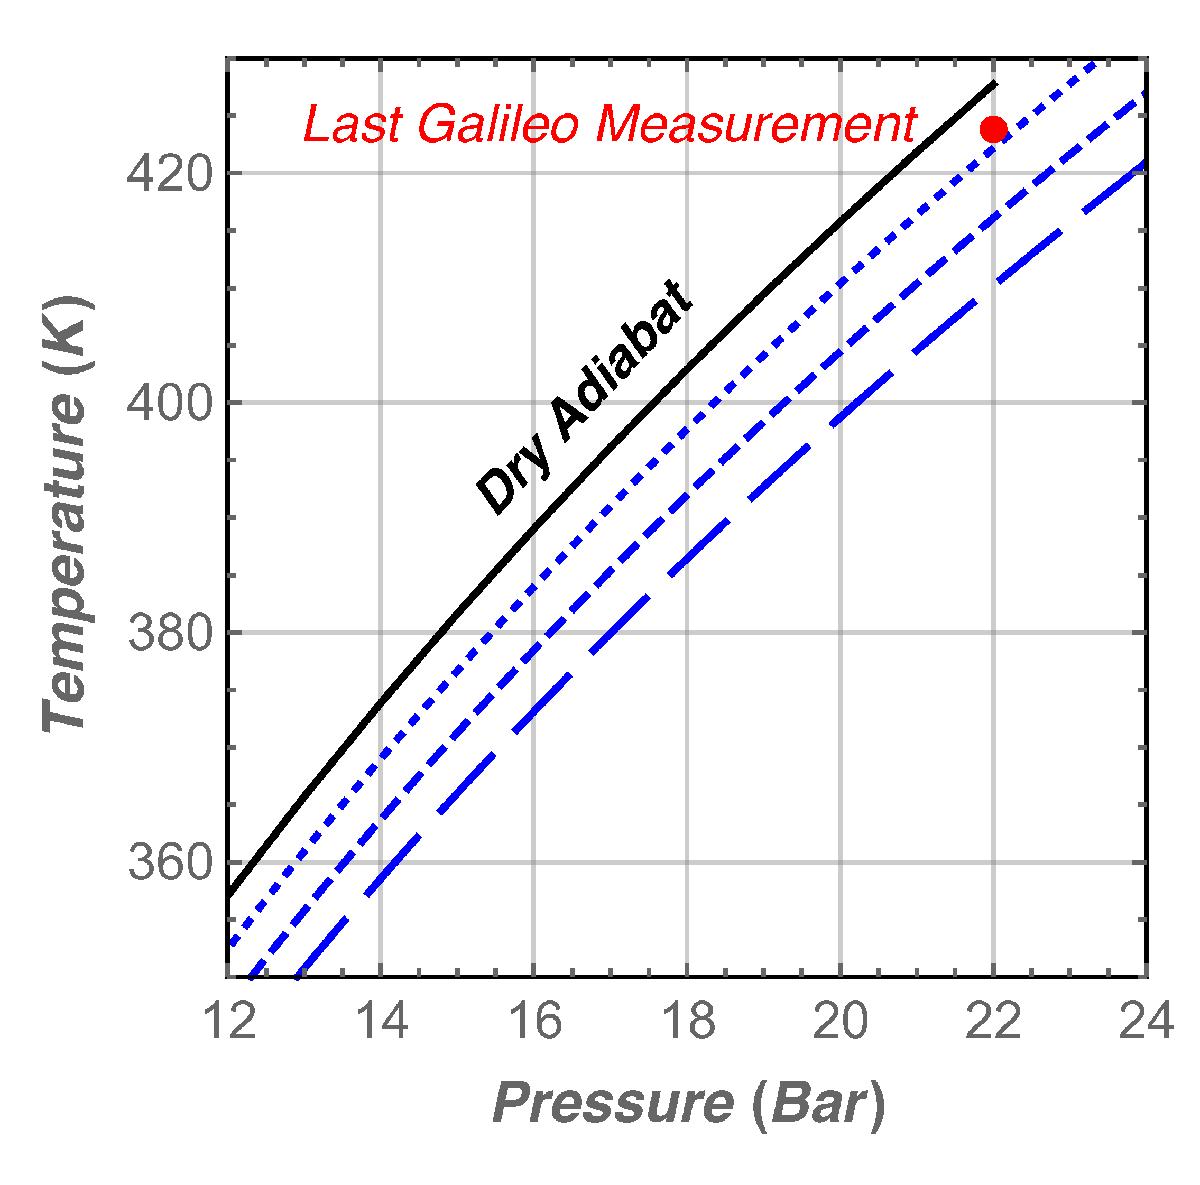
Fig. 6

Temperature profile for Jupiter focused on the end of the Galileo descent (near 22 bar). The black solid line is the dry adiabat and the blue curves are moist adiabat with qint = 0.02 (dotted), 0.04 (dashed), and 0.06 (long dashed). The red dot represents the Galileo measurement at 22 bar, which is 4 K colder than the dry adiabat. Profiles here may be slightly warmer than in Figs. 4 and 5 because they were adjusted to have a 260 K temperature at 4.18 bar to be consistent with the analysis of Seiff et al. (1998).
Current usage metrics show cumulative count of Article Views (full-text article views including HTML views, PDF and ePub downloads, according to the available data) and Abstracts Views on Vision4Press platform.
Data correspond to usage on the plateform after 2015. The current usage metrics is available 48-96 hours after online publication and is updated daily on week days.
Initial download of the metrics may take a while.


