Fig. 5
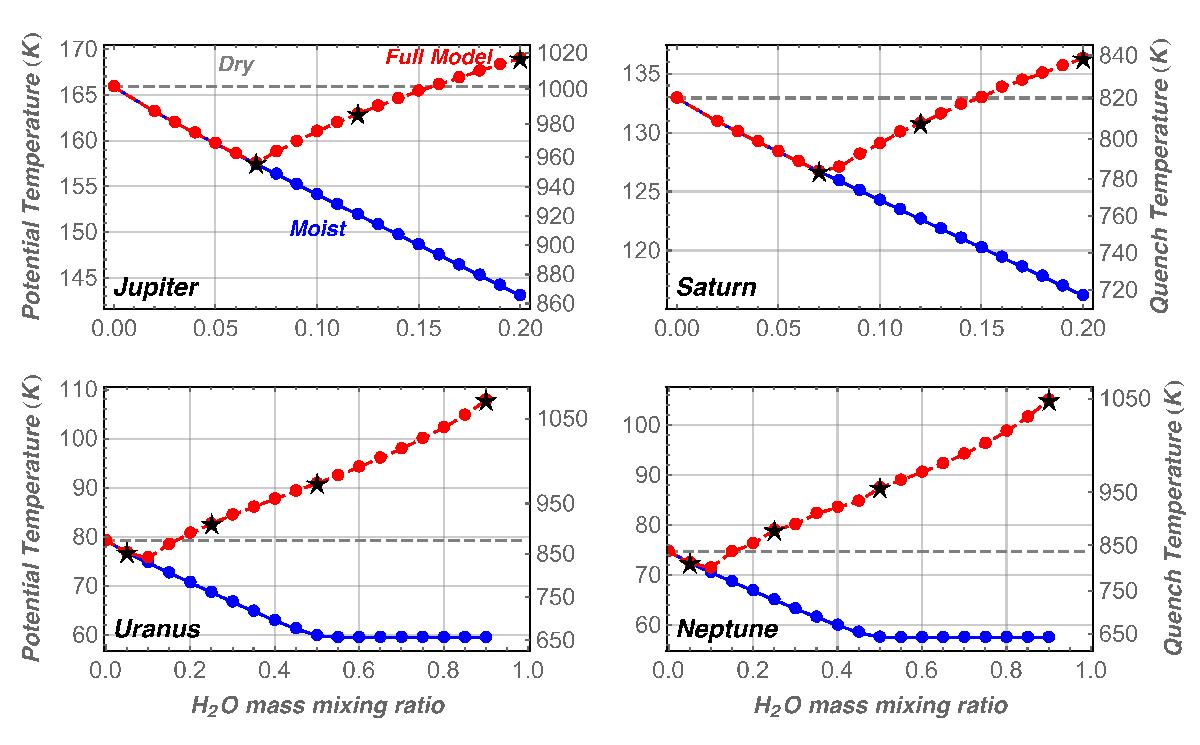
Potential temperature of the deep adiabat of the four planets as a function of the internal water mixing ratio. Models taking into account the mean molecular weight effect are shown with a red dashed curve. Black stars highlight the actual models shown in Fig. 4. The dashed gray horizontal line gives the reference for a dry adiabat, and blue dots show the temperature expected for a usual two-layer moist adiabat. The scale on the right hand side of each plot yields the conversion in real temperature at the pressure level roughly corresponding to the quenching of CO inside each planet (~400 bar for Jupiter and Saturn and ~2000 bar for Uranus and Neptune).

Current usage metrics show cumulative count of Article Views (full-text article views including HTML views, PDF and ePub downloads, according to the available data) and Abstracts Views on Vision4Press platform.
Data correspond to usage on the plateform after 2015. The current usage metrics is available 48-96 hours after online publication and is updated daily on week days.
Initial download of the metrics may take a while.