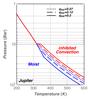
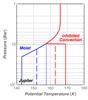
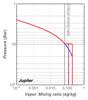
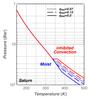
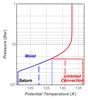
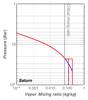
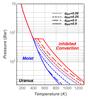
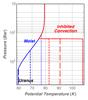
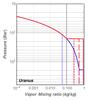
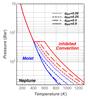
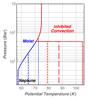
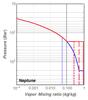
Fig. 4
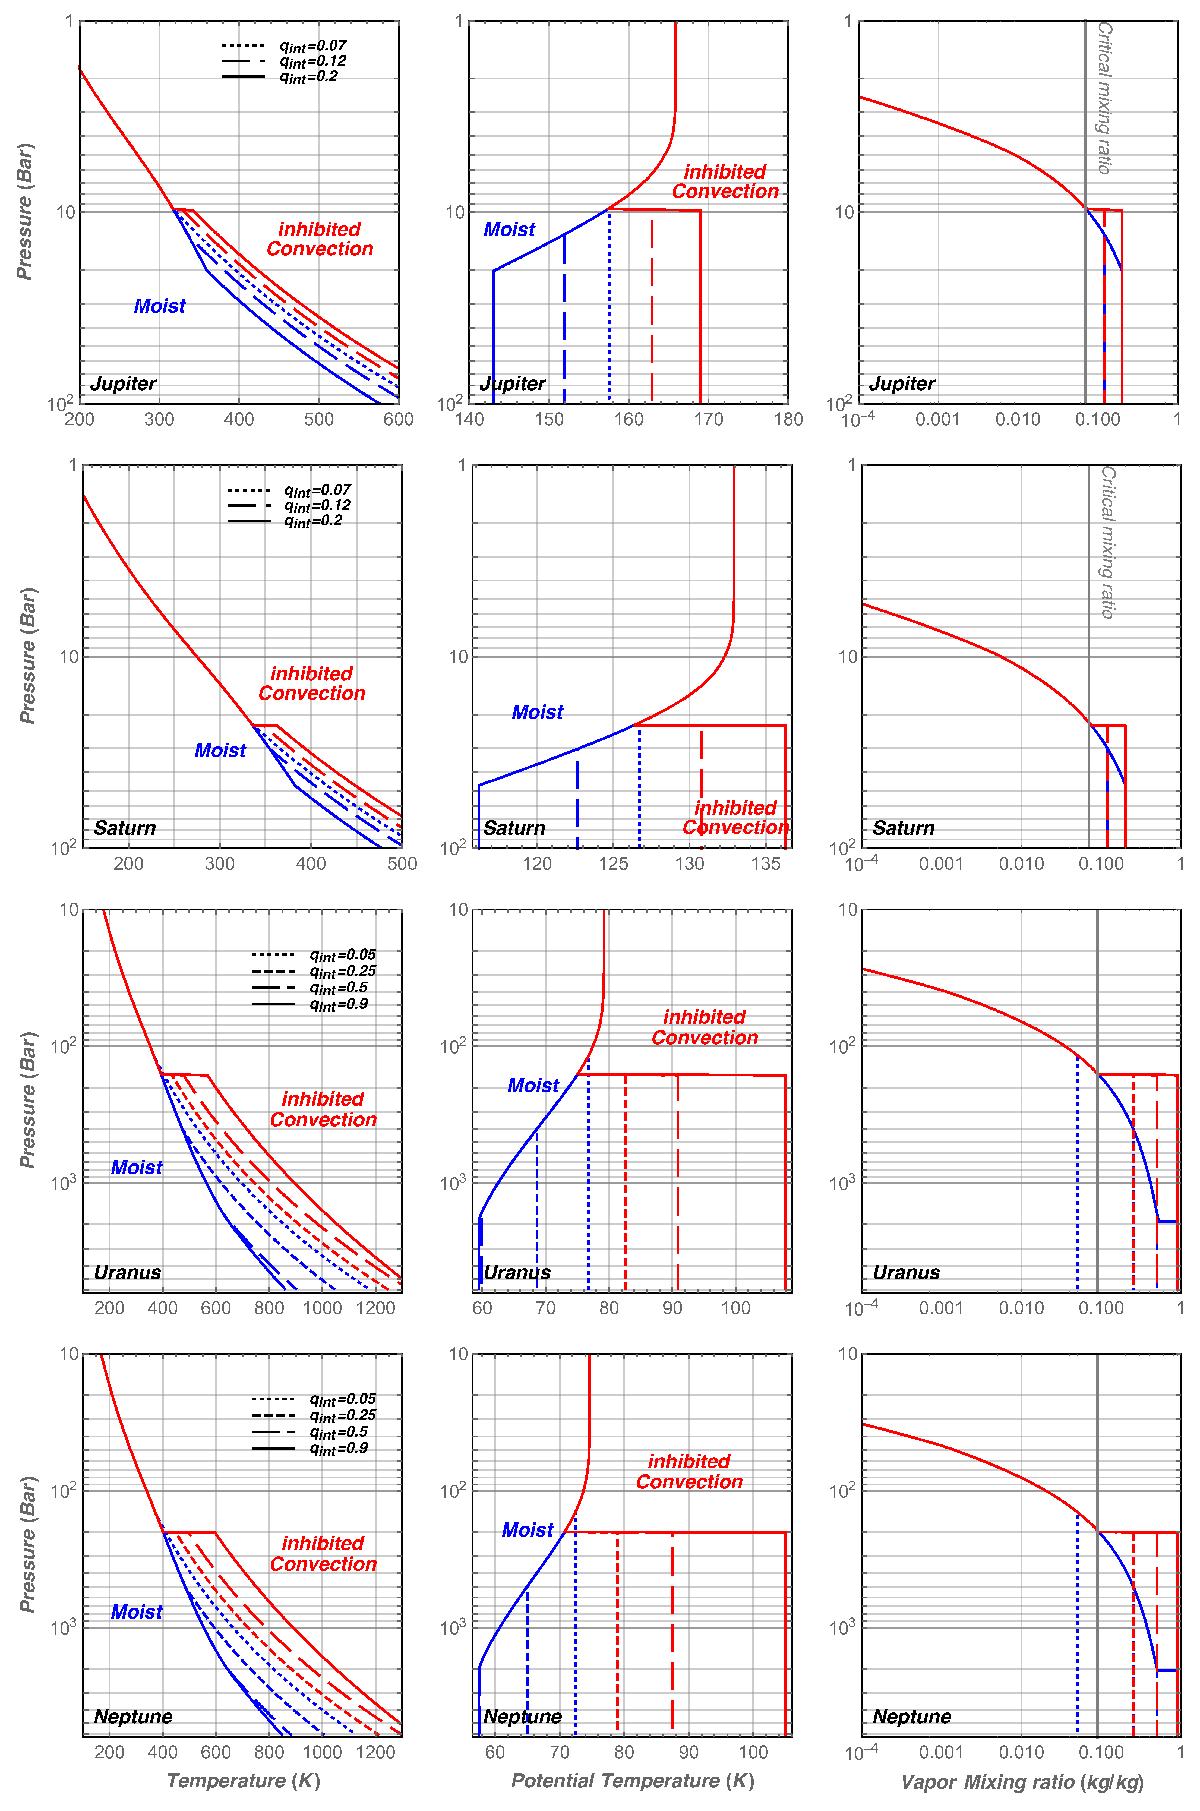
Temperature (left), potential temperature (middle), and vapor mixing ratio (right) profiles for the four giant planets (top to bottom; see label). For each planet, several internal water contents are shown (see legend on each line), corresponding to black stars in Fig. 5. Usual two-layer models following a simple moist adiabat are drawn in blue, and three-layer models with convection inhibition are shown in red (but only for models with qint>qcri ~ 0.07 that actually possess an inhibition layer). The potential temperature accounts for variations in μ and cp in the adiabatic index (see Eq. (9)), so that dry adiabats appear as vertical lines in the middle panel.
Current usage metrics show cumulative count of Article Views (full-text article views including HTML views, PDF and ePub downloads, according to the available data) and Abstracts Views on Vision4Press platform.
Data correspond to usage on the plateform after 2015. The current usage metrics is available 48-96 hours after online publication and is updated daily on week days.
Initial download of the metrics may take a while.