Fig. 3
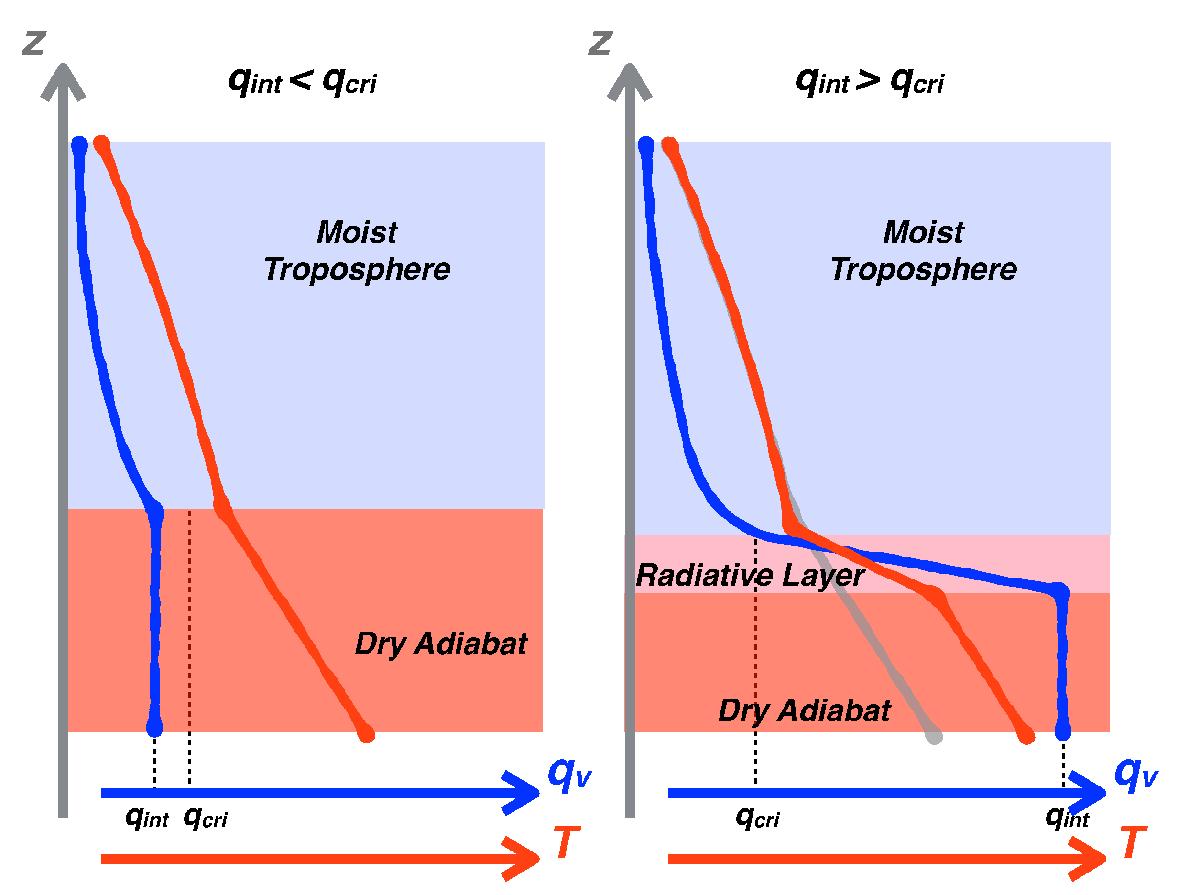
Schematic of the layers present in the atmosphere. Blue and red curves depict the water mixing ratio and temperature profiles, respectively. Left panel: standard, two-layer structure where a moist troposphere is underlain by a dry convective region (qint<qcri). Right panel: when qint>qcri, convection is inhibited above the cloud deck and a third, radiative layer appears. A gray curve replicates the temperature profile of the two-layer case to highlight the temperature increase in the deep adiabat.
Current usage metrics show cumulative count of Article Views (full-text article views including HTML views, PDF and ePub downloads, according to the available data) and Abstracts Views on Vision4Press platform.
Data correspond to usage on the plateform after 2015. The current usage metrics is available 48-96 hours after online publication and is updated daily on week days.
Initial download of the metrics may take a while.