Fig. 1
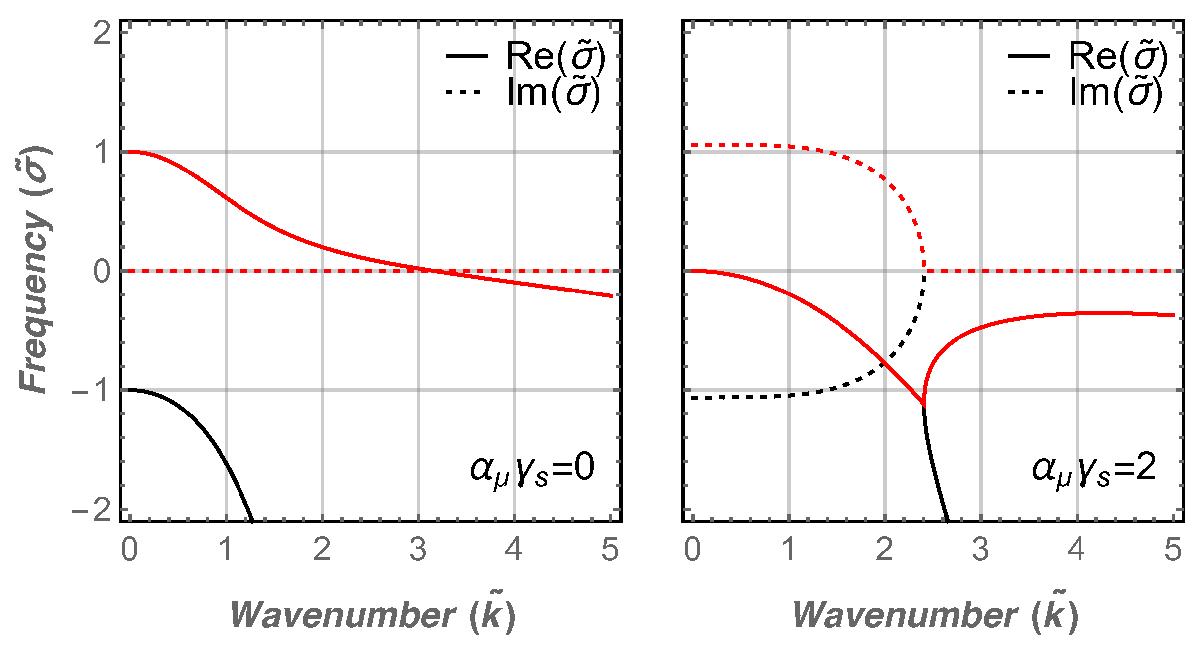
Growth rate of the two modes given by Eq. (47). The real part is denoted by a solid curve (positive means a growing mode, negative means a damped mode) and the complex part (frequency of the oscillating mode) by a dotted line. Colors are used to distinguish the two modes; red showing the most unstable one. The left panel corresponds to an unstable case for which criterion 16 is not met (qv → 0 ⇒ αμ = βc = 0). The right panel shows a case where the effect of the mean molecular weight is sufficient to stabilize the medium (αμγs = 2,βcγs = 1.7). Only a damped oscillating mode remains. Other numerical values are ![]() and (Nq/NT)2 = 30 (see Sect. 4.2.3).
and (Nq/NT)2 = 30 (see Sect. 4.2.3).
Current usage metrics show cumulative count of Article Views (full-text article views including HTML views, PDF and ePub downloads, according to the available data) and Abstracts Views on Vision4Press platform.
Data correspond to usage on the plateform after 2015. The current usage metrics is available 48-96 hours after online publication and is updated daily on week days.
Initial download of the metrics may take a while.