Free Access
Fig. 3
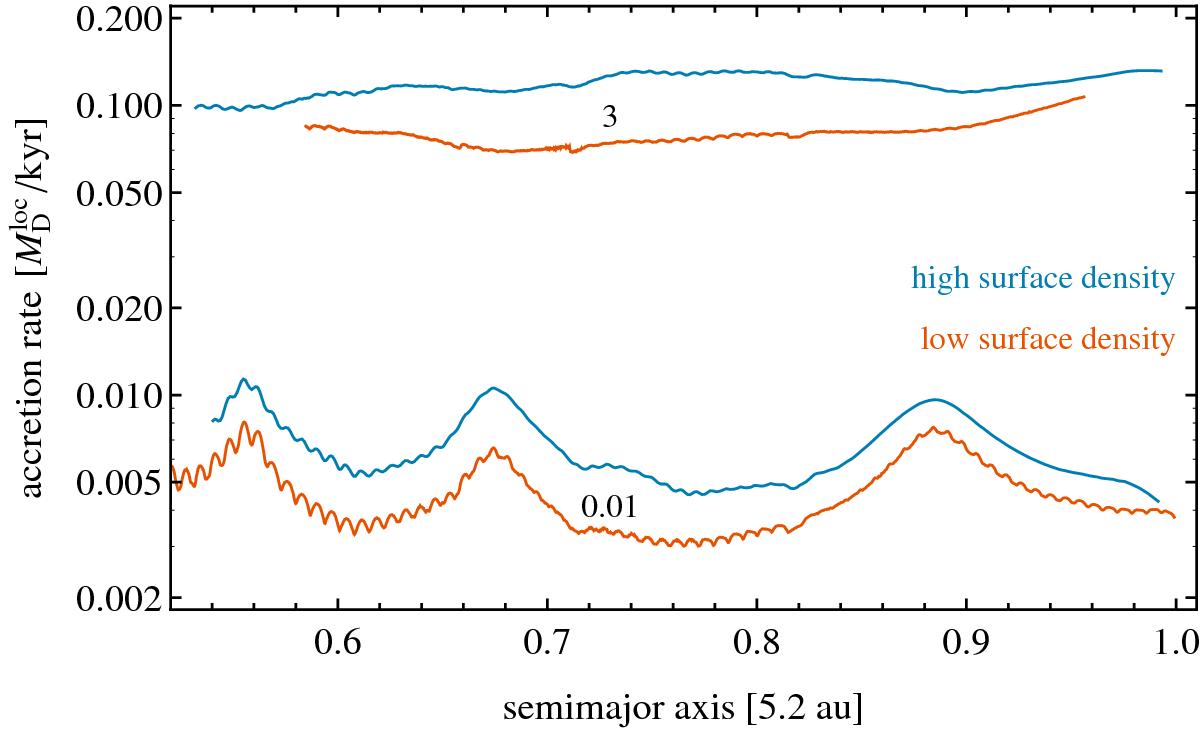
Accretion rate for selected models from Fig. 2 (measured in units of the local disk mass ![]() per kyr) as a function of the planet’s distance. Only the highest and lowest accretion fractions (numbers) are shown. The red and blue lines correspond to low and high surface density.
per kyr) as a function of the planet’s distance. Only the highest and lowest accretion fractions (numbers) are shown. The red and blue lines correspond to low and high surface density.
Current usage metrics show cumulative count of Article Views (full-text article views including HTML views, PDF and ePub downloads, according to the available data) and Abstracts Views on Vision4Press platform.
Data correspond to usage on the plateform after 2015. The current usage metrics is available 48-96 hours after online publication and is updated daily on week days.
Initial download of the metrics may take a while.