Free Access
Fig. 11
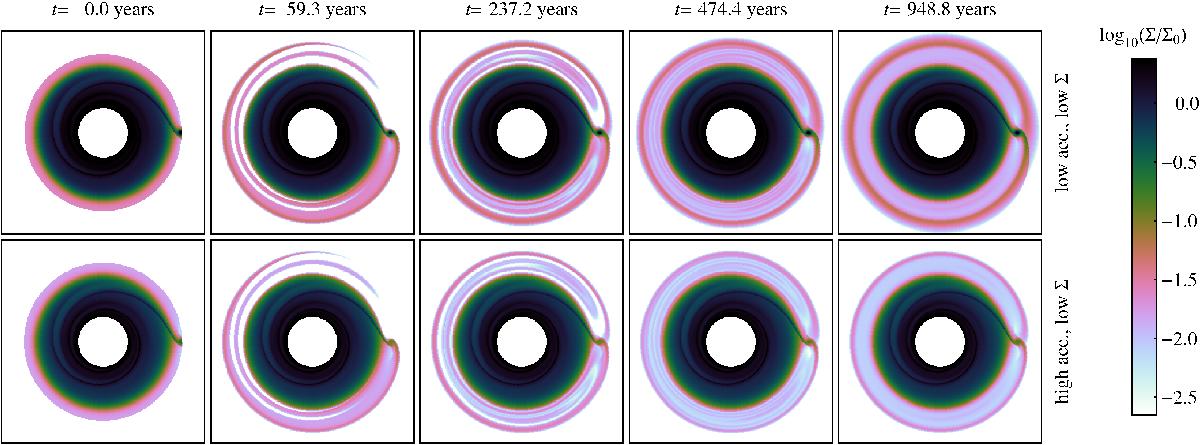
Tracer density at different times after the tracer was introduced in the simulation. Both rows show the low surface density (88 g cm-2) with low accretion fraction facc = 0.01 in the upper and facc = 3.0 in the lower row. These models correspond to the low surface density models in Fig. 10.
Current usage metrics show cumulative count of Article Views (full-text article views including HTML views, PDF and ePub downloads, according to the available data) and Abstracts Views on Vision4Press platform.
Data correspond to usage on the plateform after 2015. The current usage metrics is available 48-96 hours after online publication and is updated daily on week days.
Initial download of the metrics may take a while.