Fig. 4
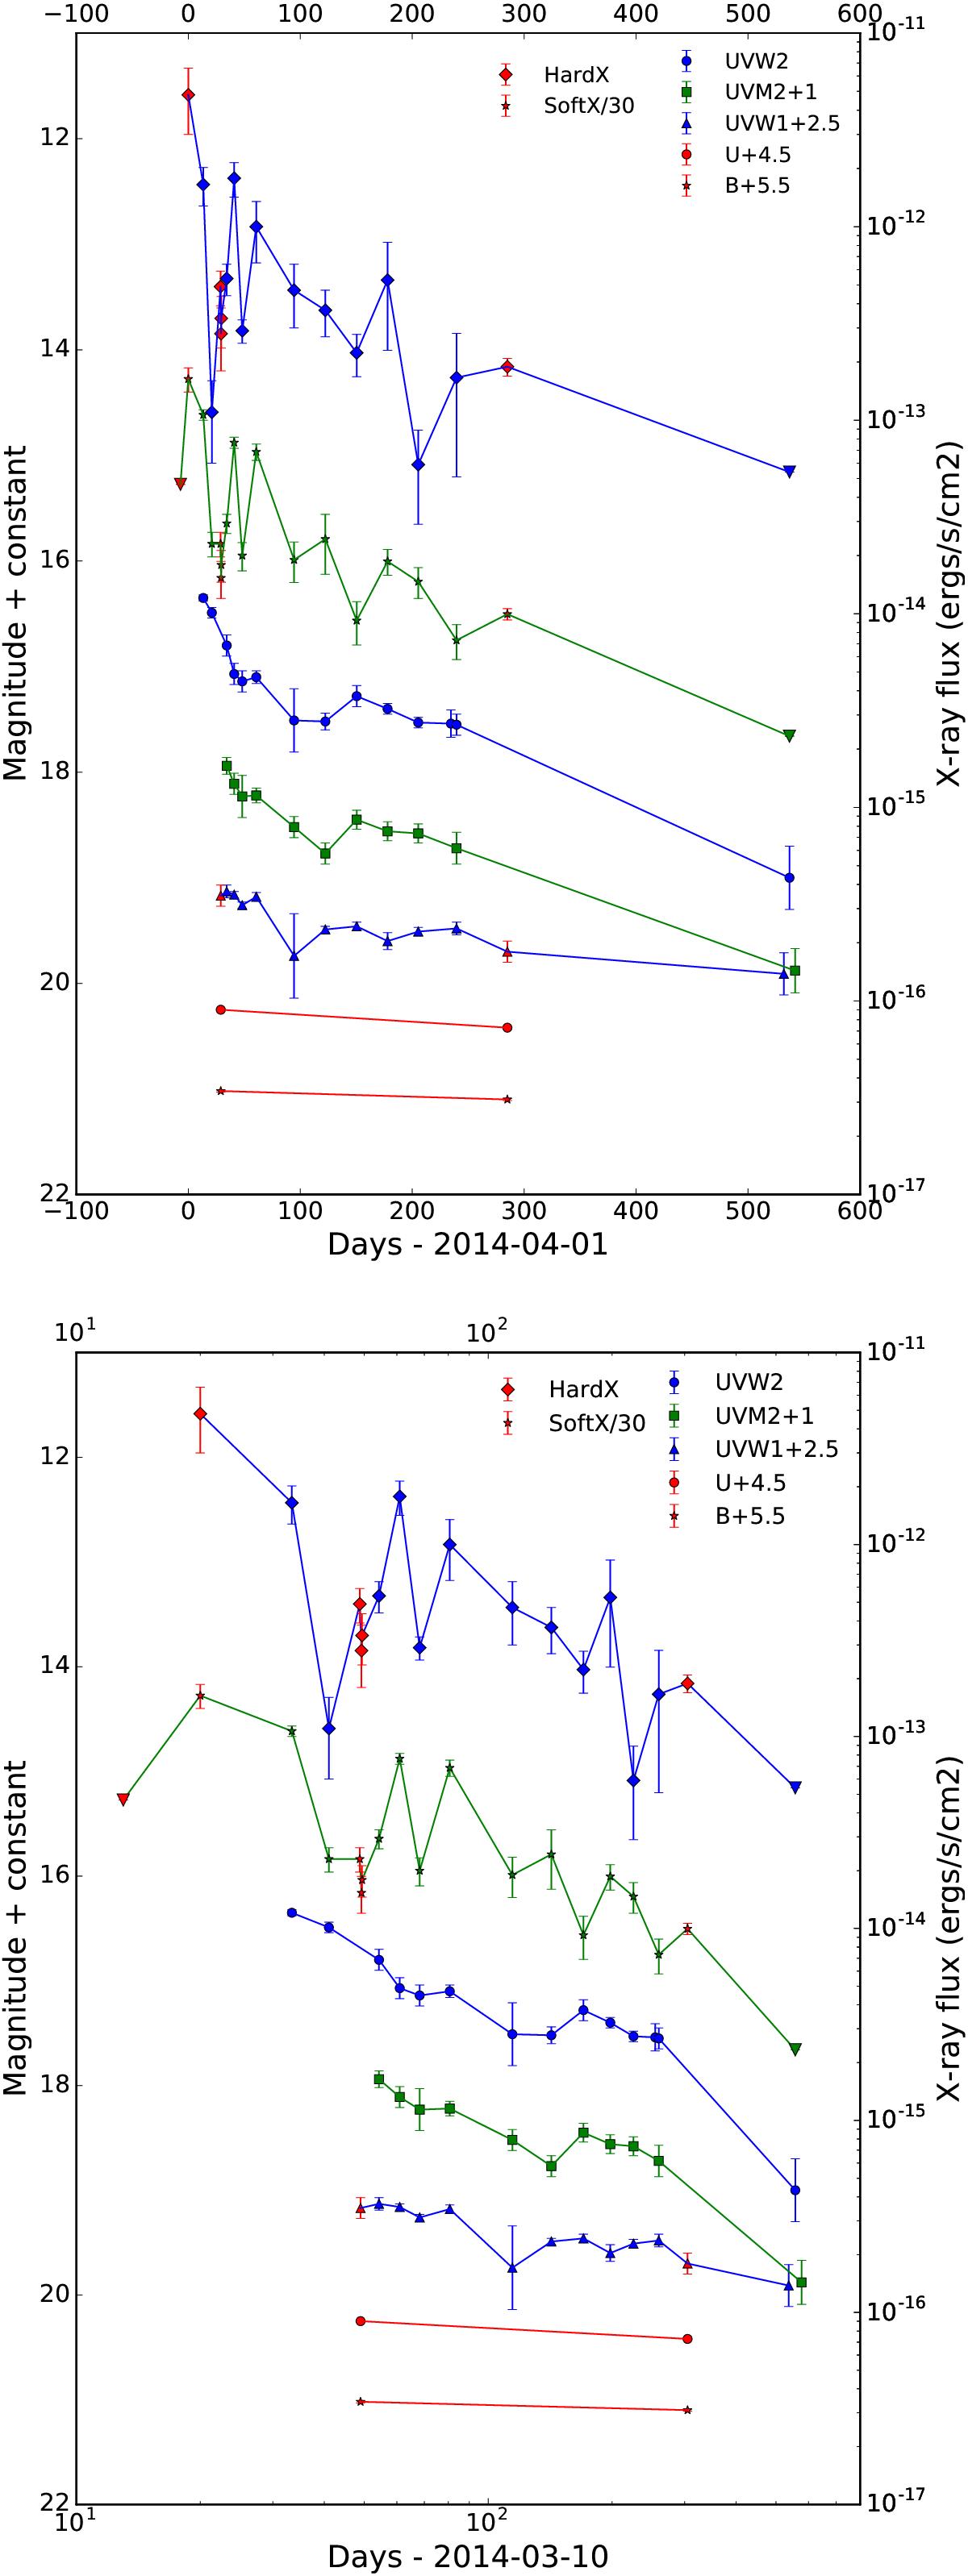
Long-term X-ray and UV light curve of XMMSL1 J0740-85 plotted against linear time (upper panel) and log time (lower panel) axes. From top to bottom, 2−10 keV, 0.2−2 keV, Swift-uvw2 (1928 Å), Swift-uvm2 (2246 Å), Swift-uvw1/XMM-OM-UVW1 (2600 Å), XMM-OM-U (3480 Å), XMM-OM-B (4500 Å). XMM-Newton points are marked in red and Swift points in blue or green. Upper limits are indicated by downwards triangles.
Current usage metrics show cumulative count of Article Views (full-text article views including HTML views, PDF and ePub downloads, according to the available data) and Abstracts Views on Vision4Press platform.
Data correspond to usage on the plateform after 2015. The current usage metrics is available 48-96 hours after online publication and is updated daily on week days.
Initial download of the metrics may take a while.