Fig. 7
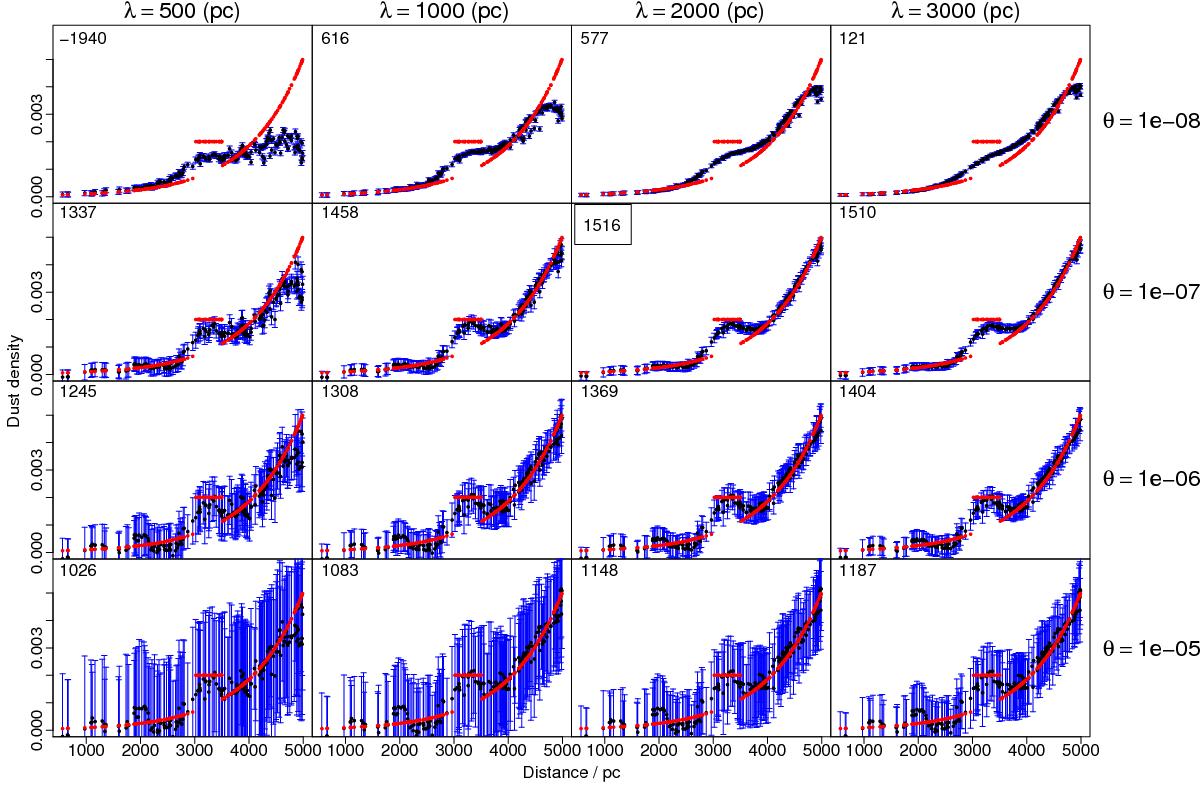
Effects of the hyperparameters on the model predictions (attenuation per parsec) in region 1 with σ = 0.1. Red points are the true values and black points with blue error bars are predictions by the model. It is important to note that the predicted uncertainties are highly correlated. Each column is for different values of λ (length scale), and each row is for different values of θ. The number in the top left corner is the natural logarithm of the reconstruction probability, defined by Eq. (18).
Current usage metrics show cumulative count of Article Views (full-text article views including HTML views, PDF and ePub downloads, according to the available data) and Abstracts Views on Vision4Press platform.
Data correspond to usage on the plateform after 2015. The current usage metrics is available 48-96 hours after online publication and is updated daily on week days.
Initial download of the metrics may take a while.