Fig. 6
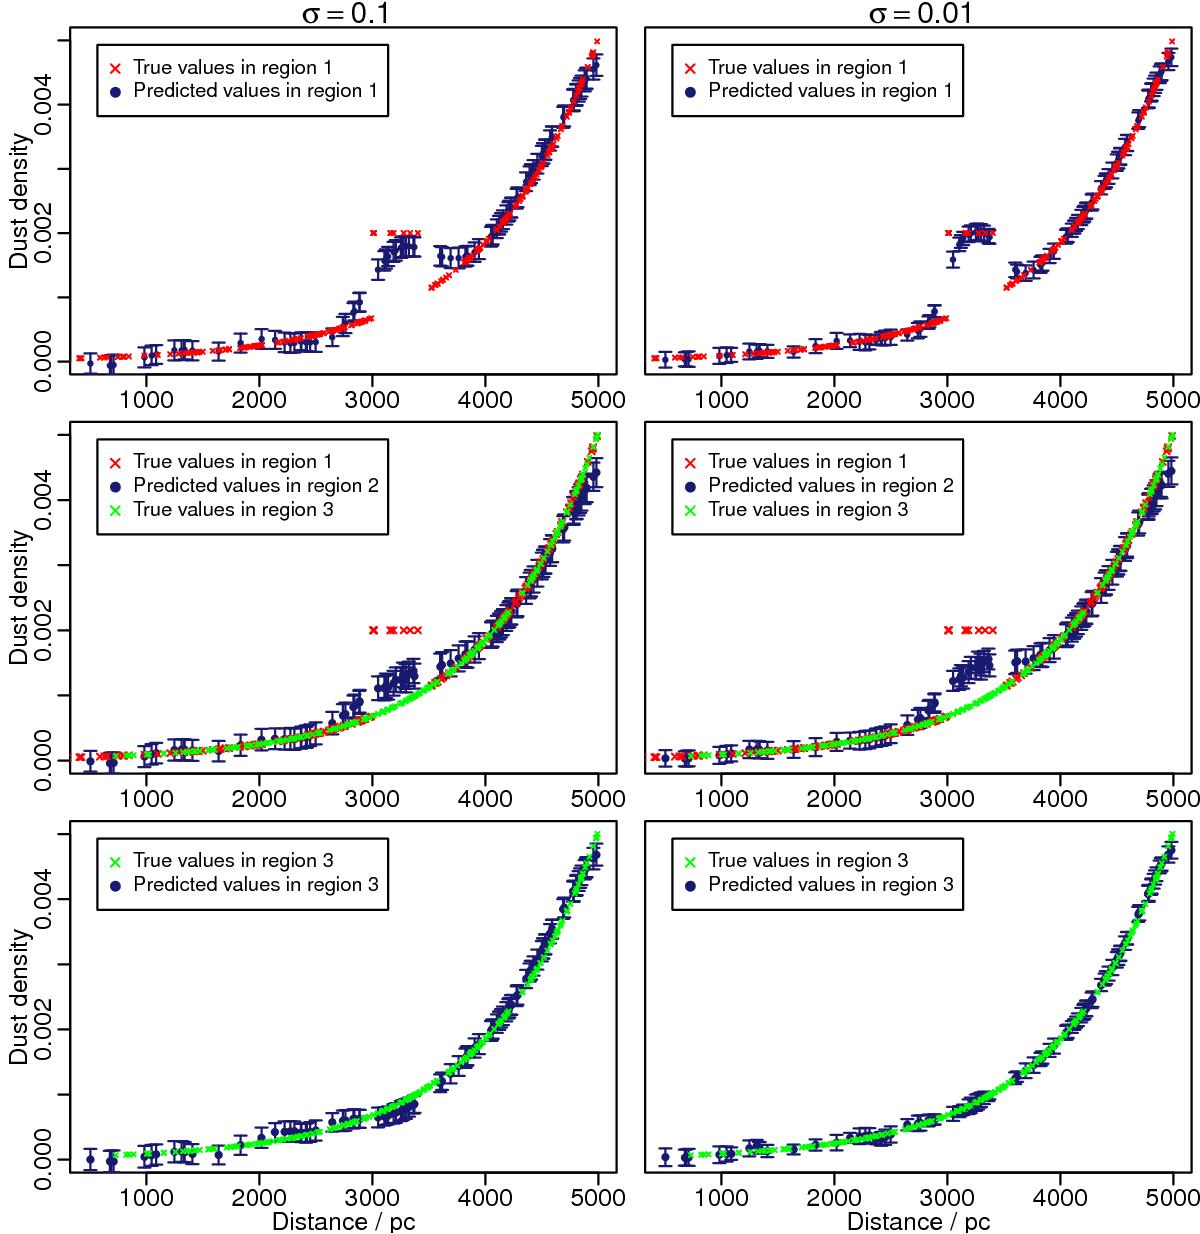
Predicted dust densities (attenuation per parsec) in the different regions of figure 4 and for two different attenuation errors: 0.1 (left) and 0.01 (right). Red and green crosses show true values for regions 1 and 3 respectively, and blue points show predicted values for different regions (1, 2 and 3 from top to bottom). The error bars on the latter points are also predicted by our model. Although there are no observations in region 2 the model can still predict dust densities there.
Current usage metrics show cumulative count of Article Views (full-text article views including HTML views, PDF and ePub downloads, according to the available data) and Abstracts Views on Vision4Press platform.
Data correspond to usage on the plateform after 2015. The current usage metrics is available 48-96 hours after online publication and is updated daily on week days.
Initial download of the metrics may take a while.