Free Access
Fig. 3
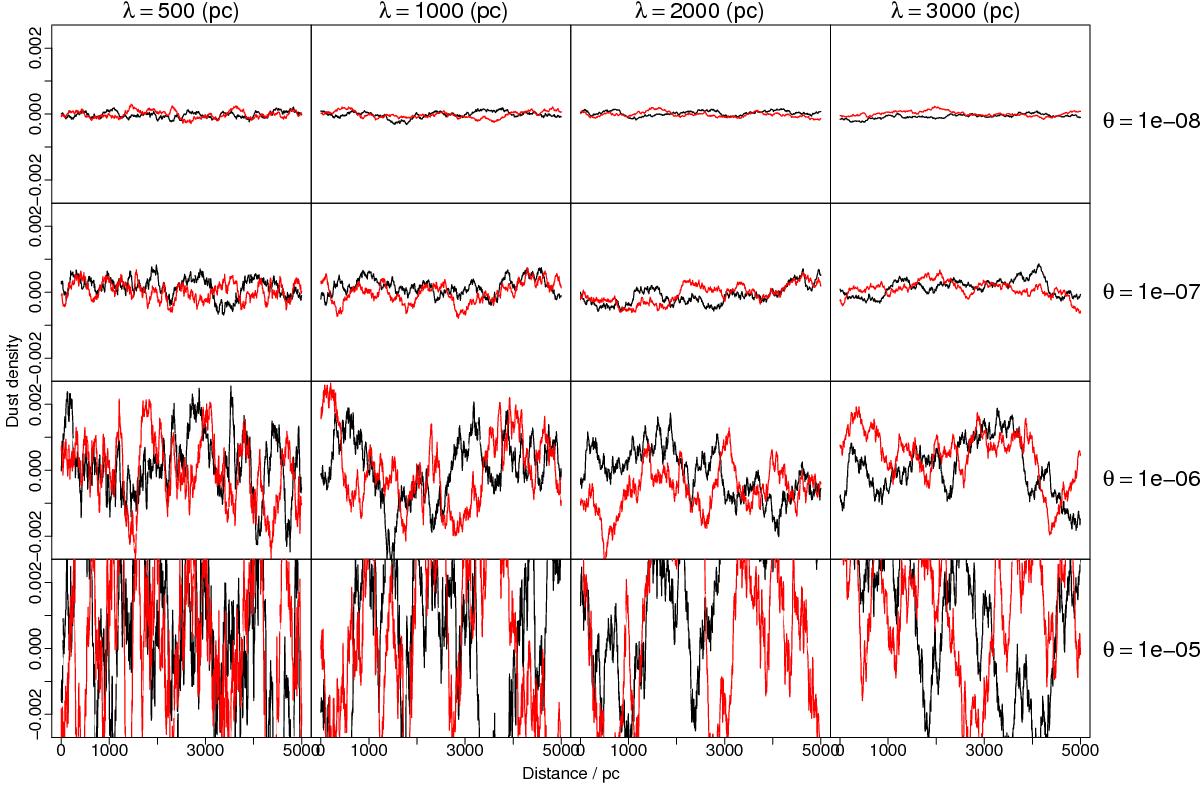
Dust density (attenuation per parsec) drawn from the prior with different hyperparameters of the covariance function (Eq. (9)). We define a 1D grid of 1000 equally-spaced points from r = 0 to r = 5000 pc and each red and black line shows one draw from a 1000-dimensional Gaussian for a fixed λ and θ.
Current usage metrics show cumulative count of Article Views (full-text article views including HTML views, PDF and ePub downloads, according to the available data) and Abstracts Views on Vision4Press platform.
Data correspond to usage on the plateform after 2015. The current usage metrics is available 48-96 hours after online publication and is updated daily on week days.
Initial download of the metrics may take a while.