Fig. 14
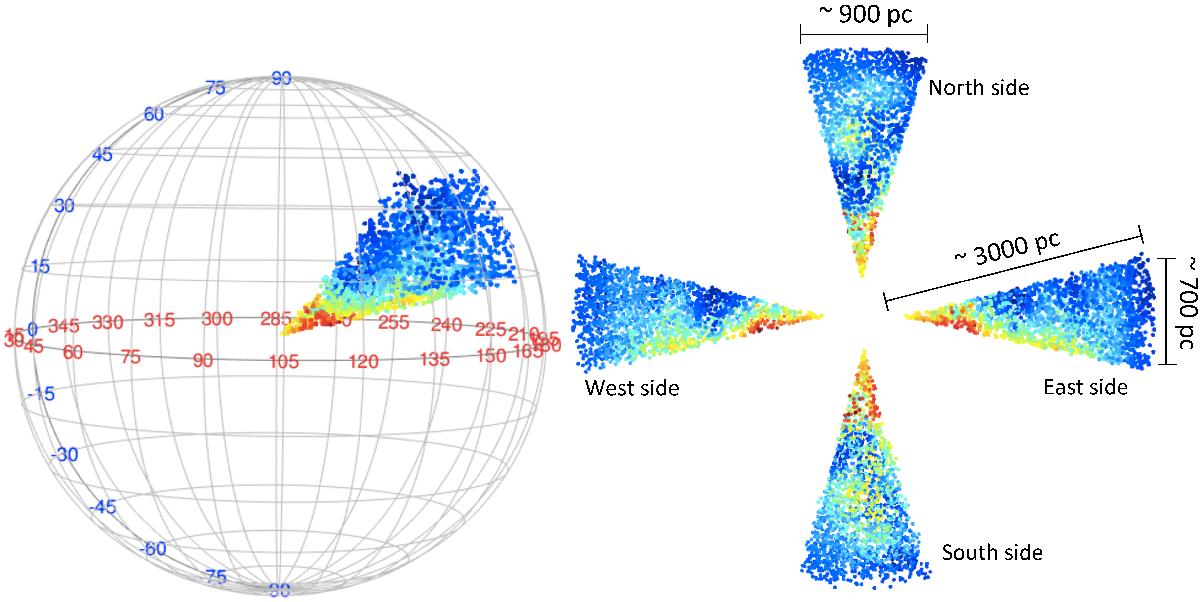
Dust densities estimated by our model over the pyramid-shaped region 68° < l < 85°, 6° < b < 20°, d < 3 kpc, computed using the extinction and distance data from Rodrigues et al. (2014). The left panel shows the data in three dimensions. The right panel shows the dust density in projection as viewed from the outside sides of the pyramid; “north” means looking from top to bottom, perpendicular to the upper side of the pyramid, and similarly for “south” (looking from the bottom). The “east” and “west” views are looking perpendicular to the sides of the pyramid, where “east” means looking from higher longitudes to lower ones, and “west” from lower to higher. Colour scale is as in Fig. 13. It should be noted that these triangles are plotted with a larger scale parallel to their base (transverse to the LoS from the Sun) – a larger opening angle than in reality – in order to better resolve the details.
Current usage metrics show cumulative count of Article Views (full-text article views including HTML views, PDF and ePub downloads, according to the available data) and Abstracts Views on Vision4Press platform.
Data correspond to usage on the plateform after 2015. The current usage metrics is available 48-96 hours after online publication and is updated daily on week days.
Initial download of the metrics may take a while.