Free Access
Fig. 13
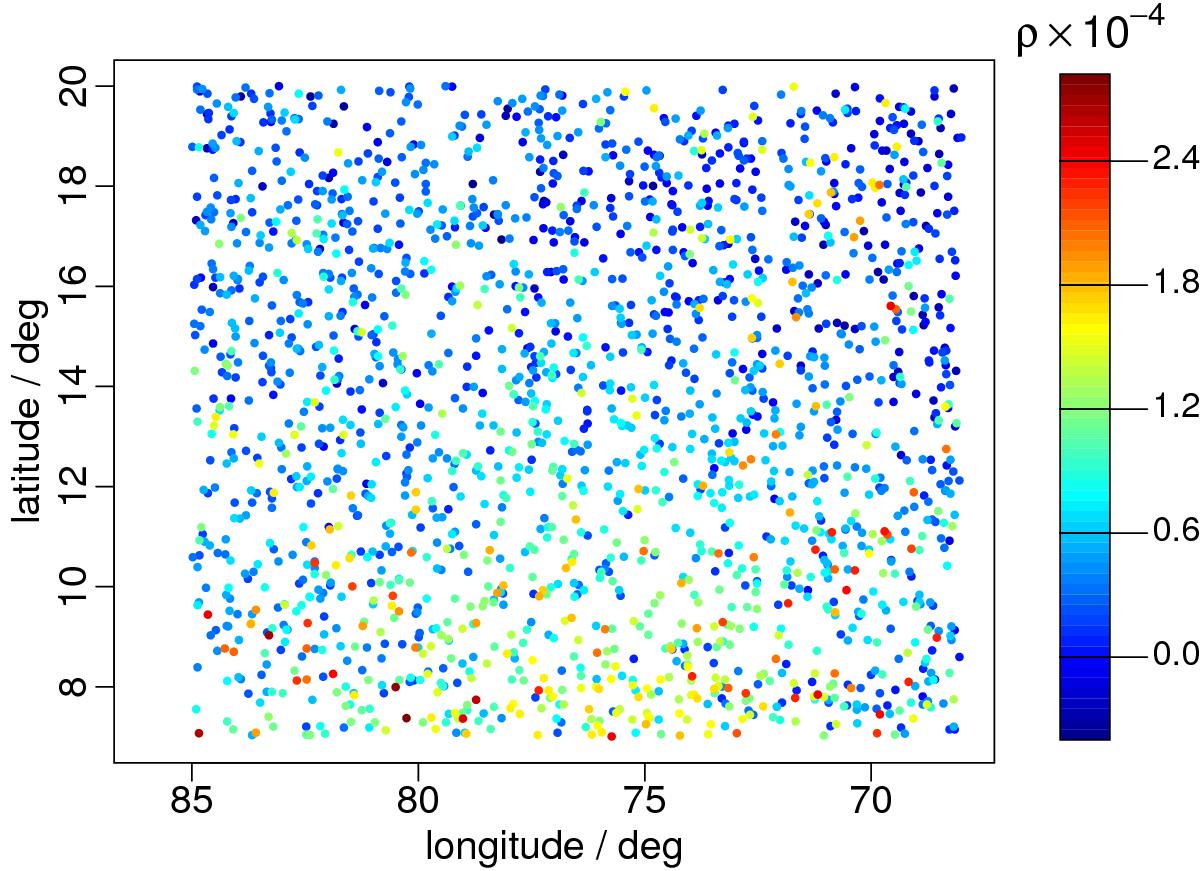
Inferred dust density (attenuation per parsec) for the area of 68° <l < 85° and 6° < b < 20° out to 3 kpc using data from Rodrigues et al. (2014) shown in 2D with the same frame as Fig. 12 (the input data). It should be noted that dust density is local in 3D and these points lie at a range of distances as seen in Fig. 15.
Current usage metrics show cumulative count of Article Views (full-text article views including HTML views, PDF and ePub downloads, according to the available data) and Abstracts Views on Vision4Press platform.
Data correspond to usage on the plateform after 2015. The current usage metrics is available 48-96 hours after online publication and is updated daily on week days.
Initial download of the metrics may take a while.