Fig. 11
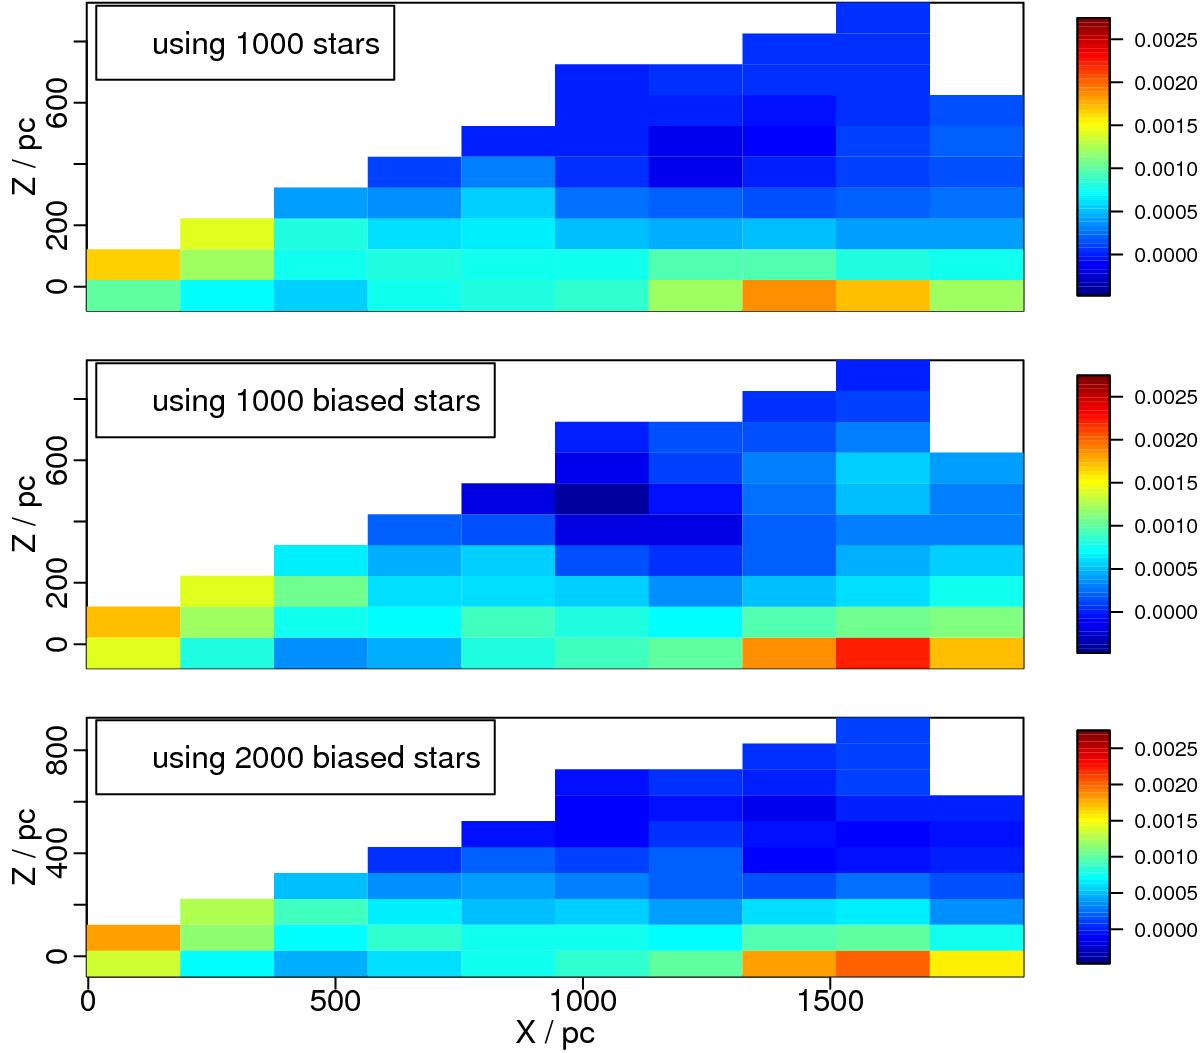
Effect of different sampling on the dust density predictions (attenuation per parsec, shown as the colour scale) for the region of 5° < l < 7° and −1° <b < 30° using GUMS catalogue (Sect. 3.2). Top panel shows the predictions using 1000 randomly sampled input data (from the entire 52 000), the middle panel is the results using 1000 input stars which sampled in a biased way towards high value attenuations, and the lower panel shows predictions in case of the same biased sampling but using 2000 stars. The results are pretty much consistent, capturing similar trends.
Current usage metrics show cumulative count of Article Views (full-text article views including HTML views, PDF and ePub downloads, according to the available data) and Abstracts Views on Vision4Press platform.
Data correspond to usage on the plateform after 2015. The current usage metrics is available 48-96 hours after online publication and is updated daily on week days.
Initial download of the metrics may take a while.