Free Access
Fig. 10
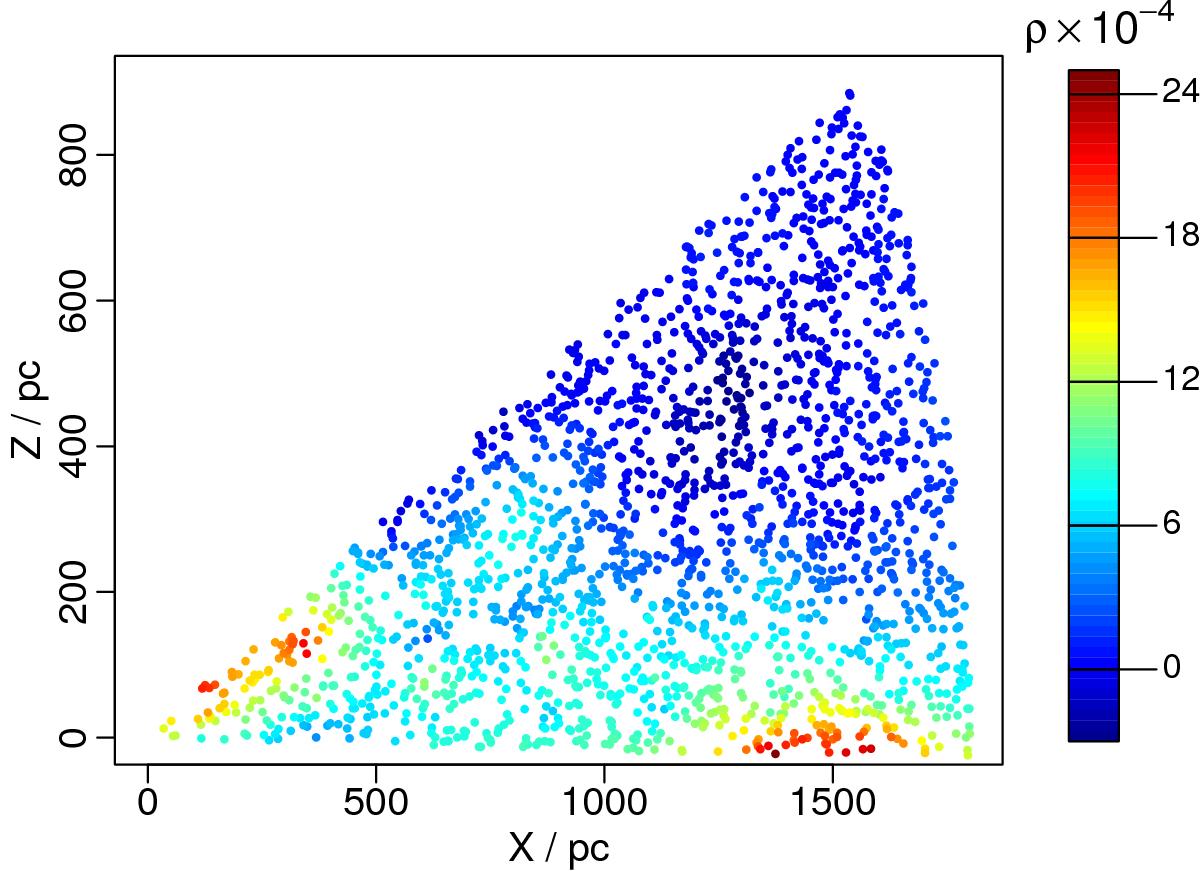
Predictions of the dust densities for the selected area from GUMS catalogue (5° <l < 7° and −1° < b < 30°) for 2000 new points in two dimension coloured coded by the dust density values. A high value dust cloud is seen at the large distances and low latitudes as well as some lower-value dust clouds in other locations.
Current usage metrics show cumulative count of Article Views (full-text article views including HTML views, PDF and ePub downloads, according to the available data) and Abstracts Views on Vision4Press platform.
Data correspond to usage on the plateform after 2015. The current usage metrics is available 48-96 hours after online publication and is updated daily on week days.
Initial download of the metrics may take a while.