Fig. 8
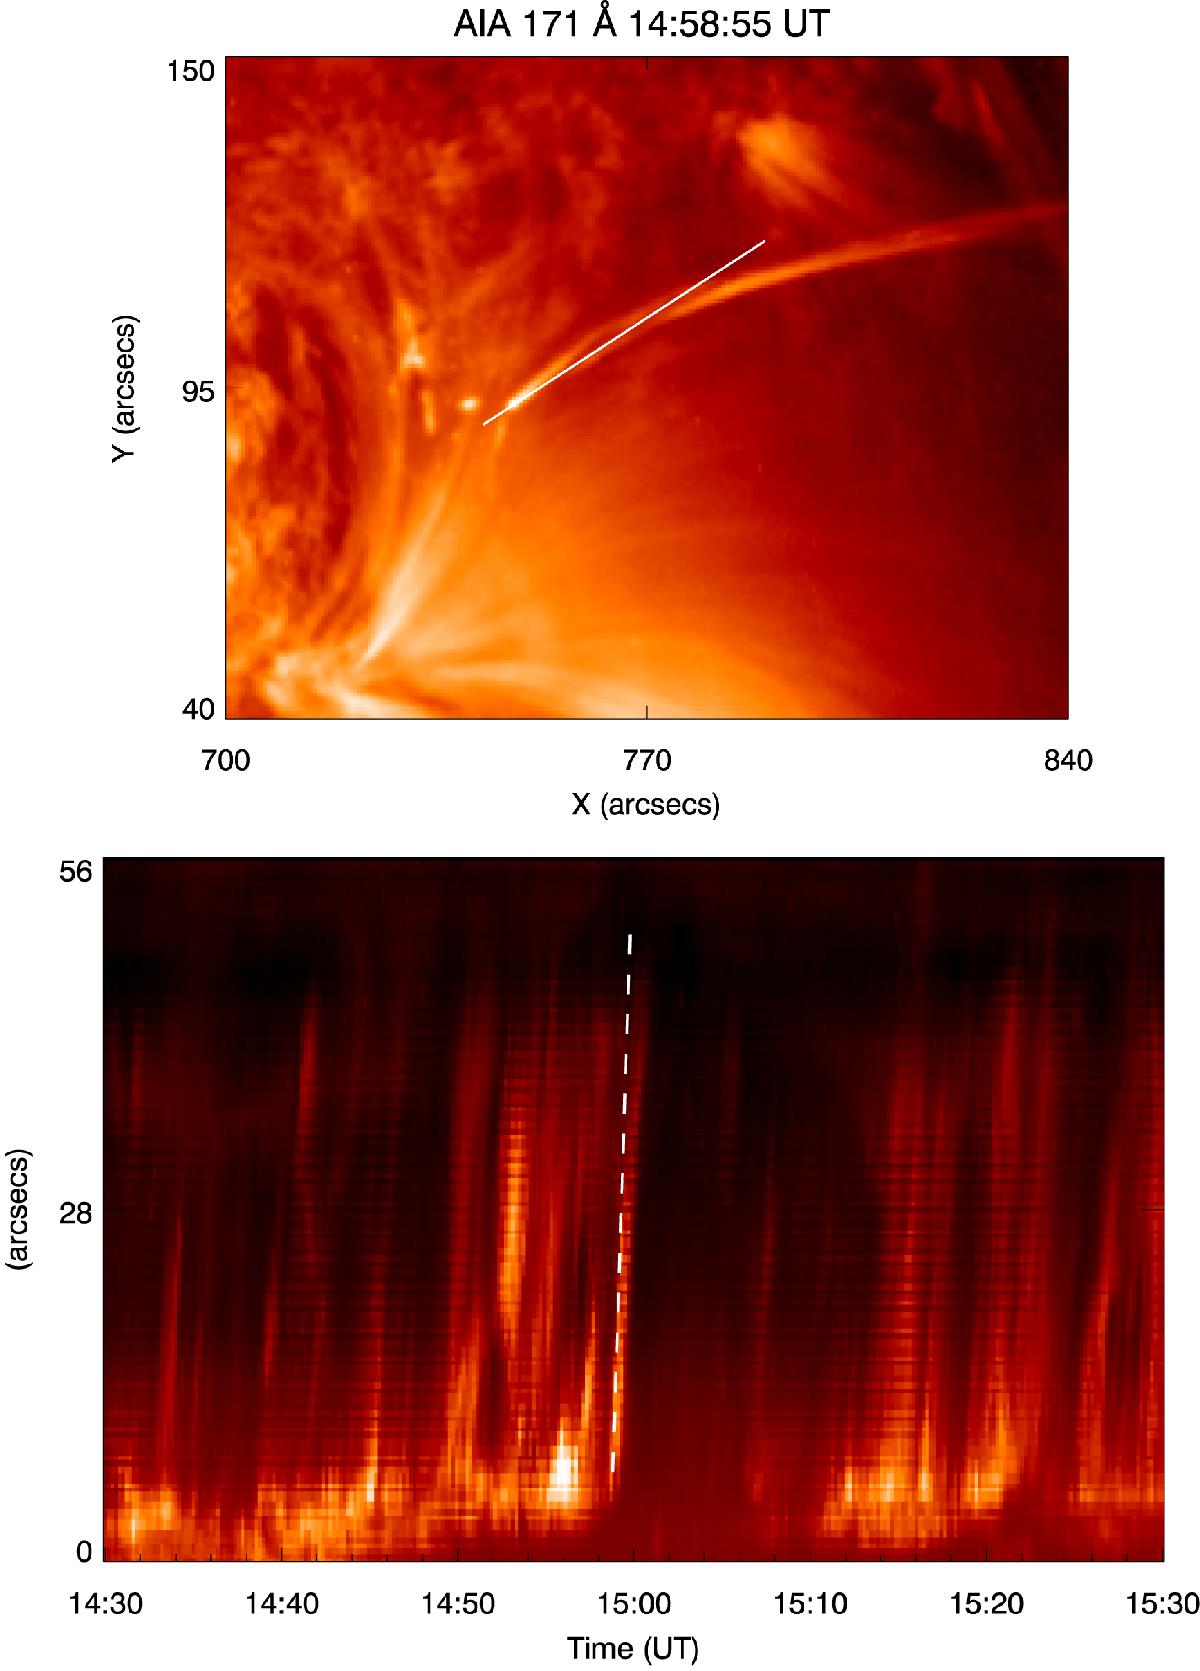
Top panel: the jet evolution in the AIA 171 Å channel at 14:58:55 UT. The overplotted white line shows an artificial slit, which is used to produce a time-distance plot. Bottom panel: time-distance plot along the jet spire for an hour from 14:30 to 15:30 UT. The white dashed line used for the velocity calculation, which is found to be 524 km s.
Current usage metrics show cumulative count of Article Views (full-text article views including HTML views, PDF and ePub downloads, according to the available data) and Abstracts Views on Vision4Press platform.
Data correspond to usage on the plateform after 2015. The current usage metrics is available 48-96 hours after online publication and is updated daily on week days.
Initial download of the metrics may take a while.