Fig. 7
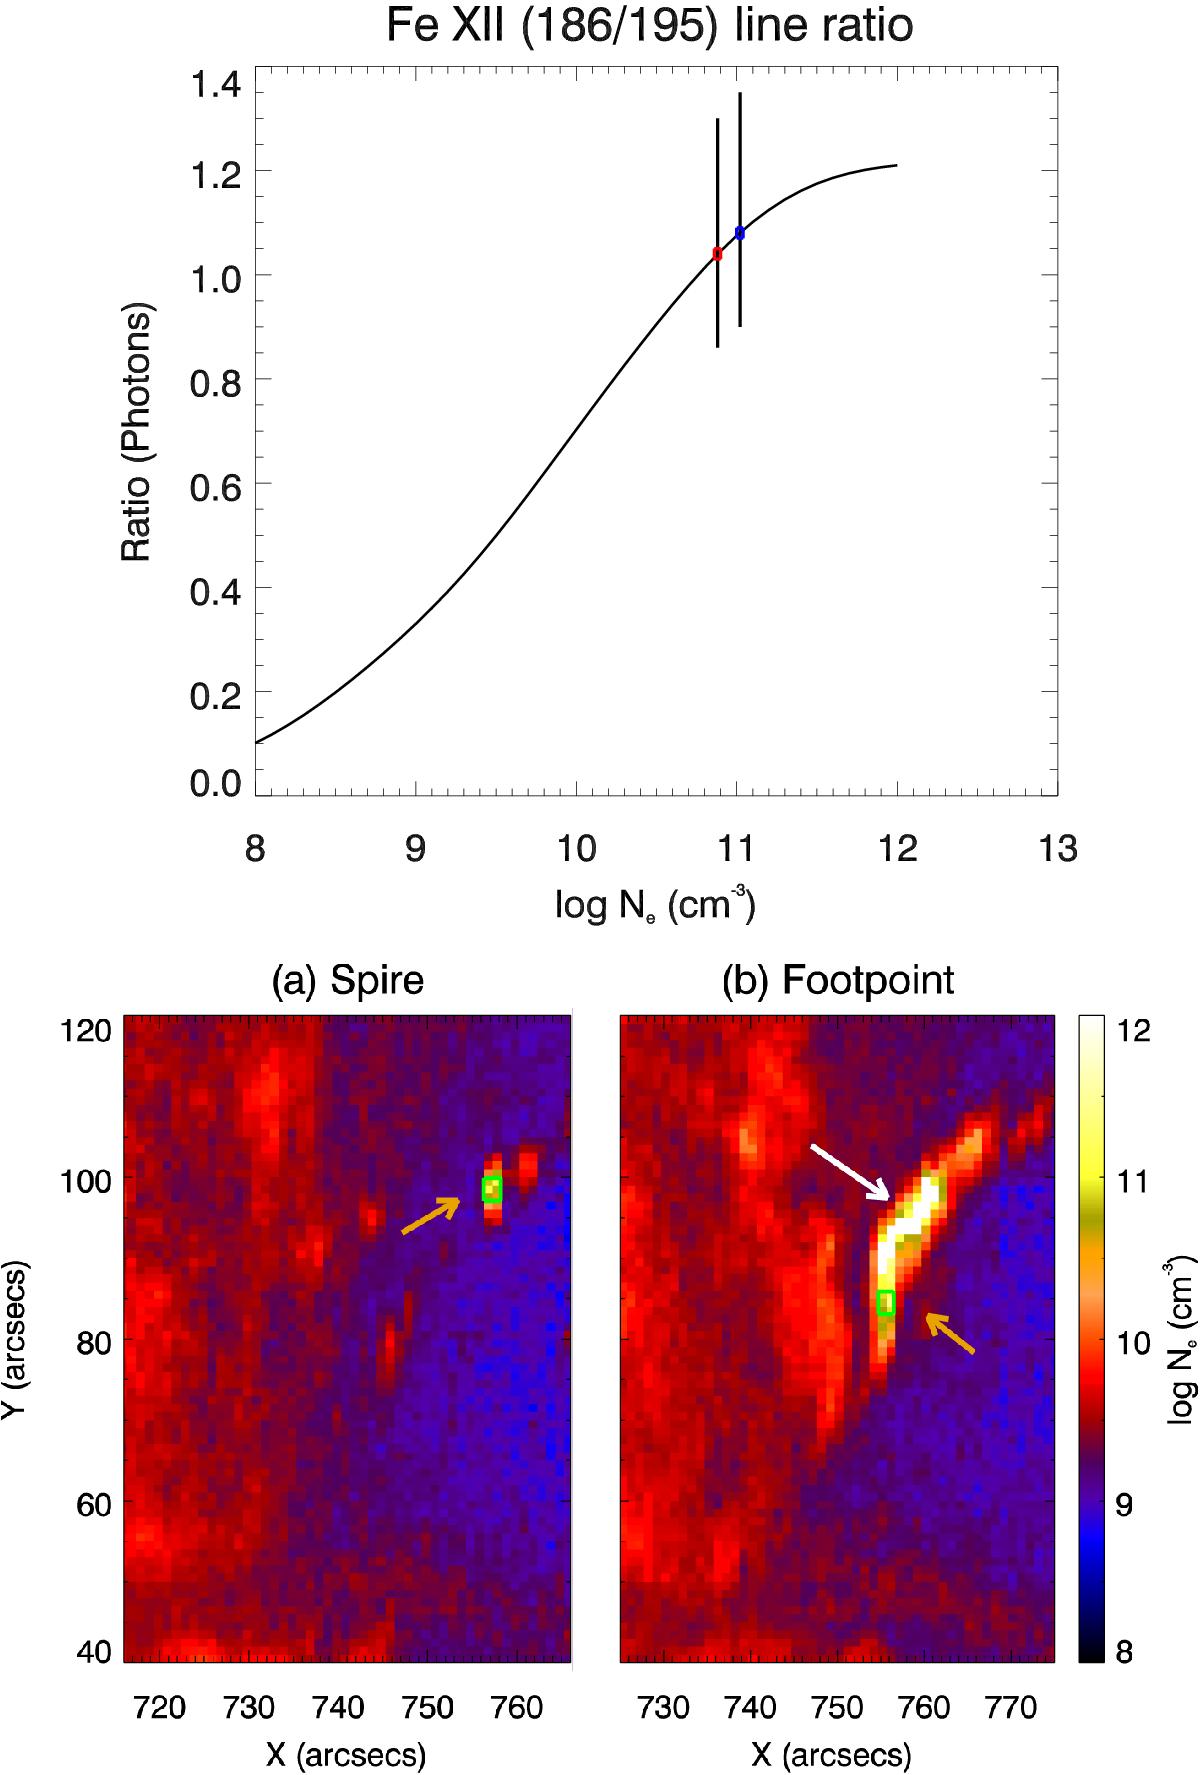
Top panel: theoretical intensity of the Fe XII (λ186/λ195) line ratio as a function of electron density. The density ratio for the jet spire and jet footpoint are shown with red and blue boxes, respectively. The vertical lines overplotted on the curve shows the errors estimated by considering 20% uncertainty. Bottom panels: electron density maps for the a) jet spire and the b) jet footpoint. The electron densities are in logarithmic scale in cm-3 units. The regions used for the density diagnostics are shown with green boxes (indicated by orange arrows).
Current usage metrics show cumulative count of Article Views (full-text article views including HTML views, PDF and ePub downloads, according to the available data) and Abstracts Views on Vision4Press platform.
Data correspond to usage on the plateform after 2015. The current usage metrics is available 48-96 hours after online publication and is updated daily on week days.
Initial download of the metrics may take a while.