Fig. 6
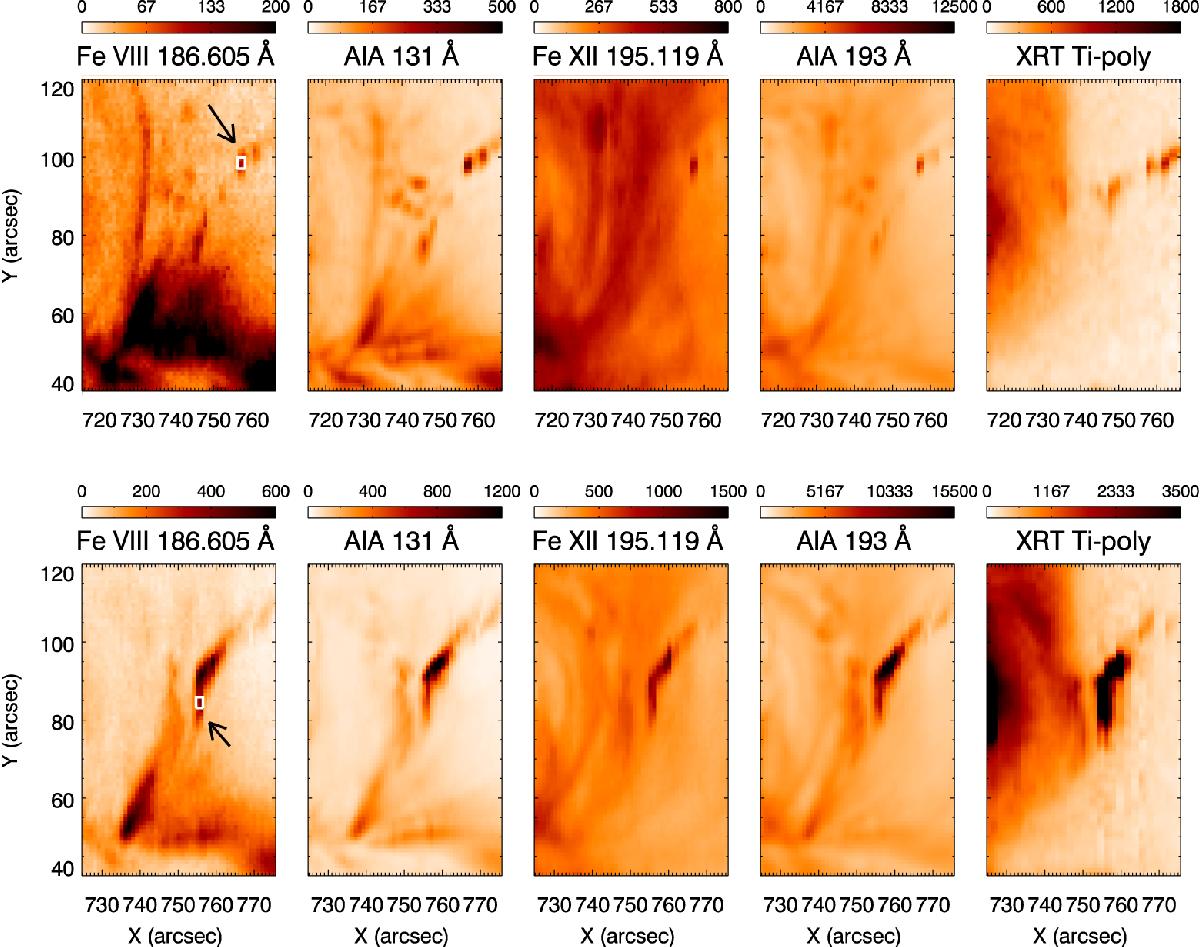
AIA-EIS-XRT co-aligned images (reverse colour) of the jet spire (top panel) and the jet footpoint (bottom panel). Column 1 and 3: EIS intensity images in Fe VIII (λ186.605) and Fe XII (λ195.119), respectively. Columns 2 and 4: time-averaged rebinned maps in the AIA 131 and 193 Å channels, respectively. Column 5: a coaligned map in the Ti-poly filter. The colour bars for the EIS rasters indicate the actual calibrated units (phot cm-2 s-1 arcsec-2) and the units are DN s-1 EIS pixel-1 for AIA images. The regions shown with white boxes (indicated by black arrows) are used for the DEM analysis (see Sect. 3.6).
Current usage metrics show cumulative count of Article Views (full-text article views including HTML views, PDF and ePub downloads, according to the available data) and Abstracts Views on Vision4Press platform.
Data correspond to usage on the plateform after 2015. The current usage metrics is available 48-96 hours after online publication and is updated daily on week days.
Initial download of the metrics may take a while.