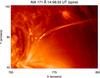
Fig. 4
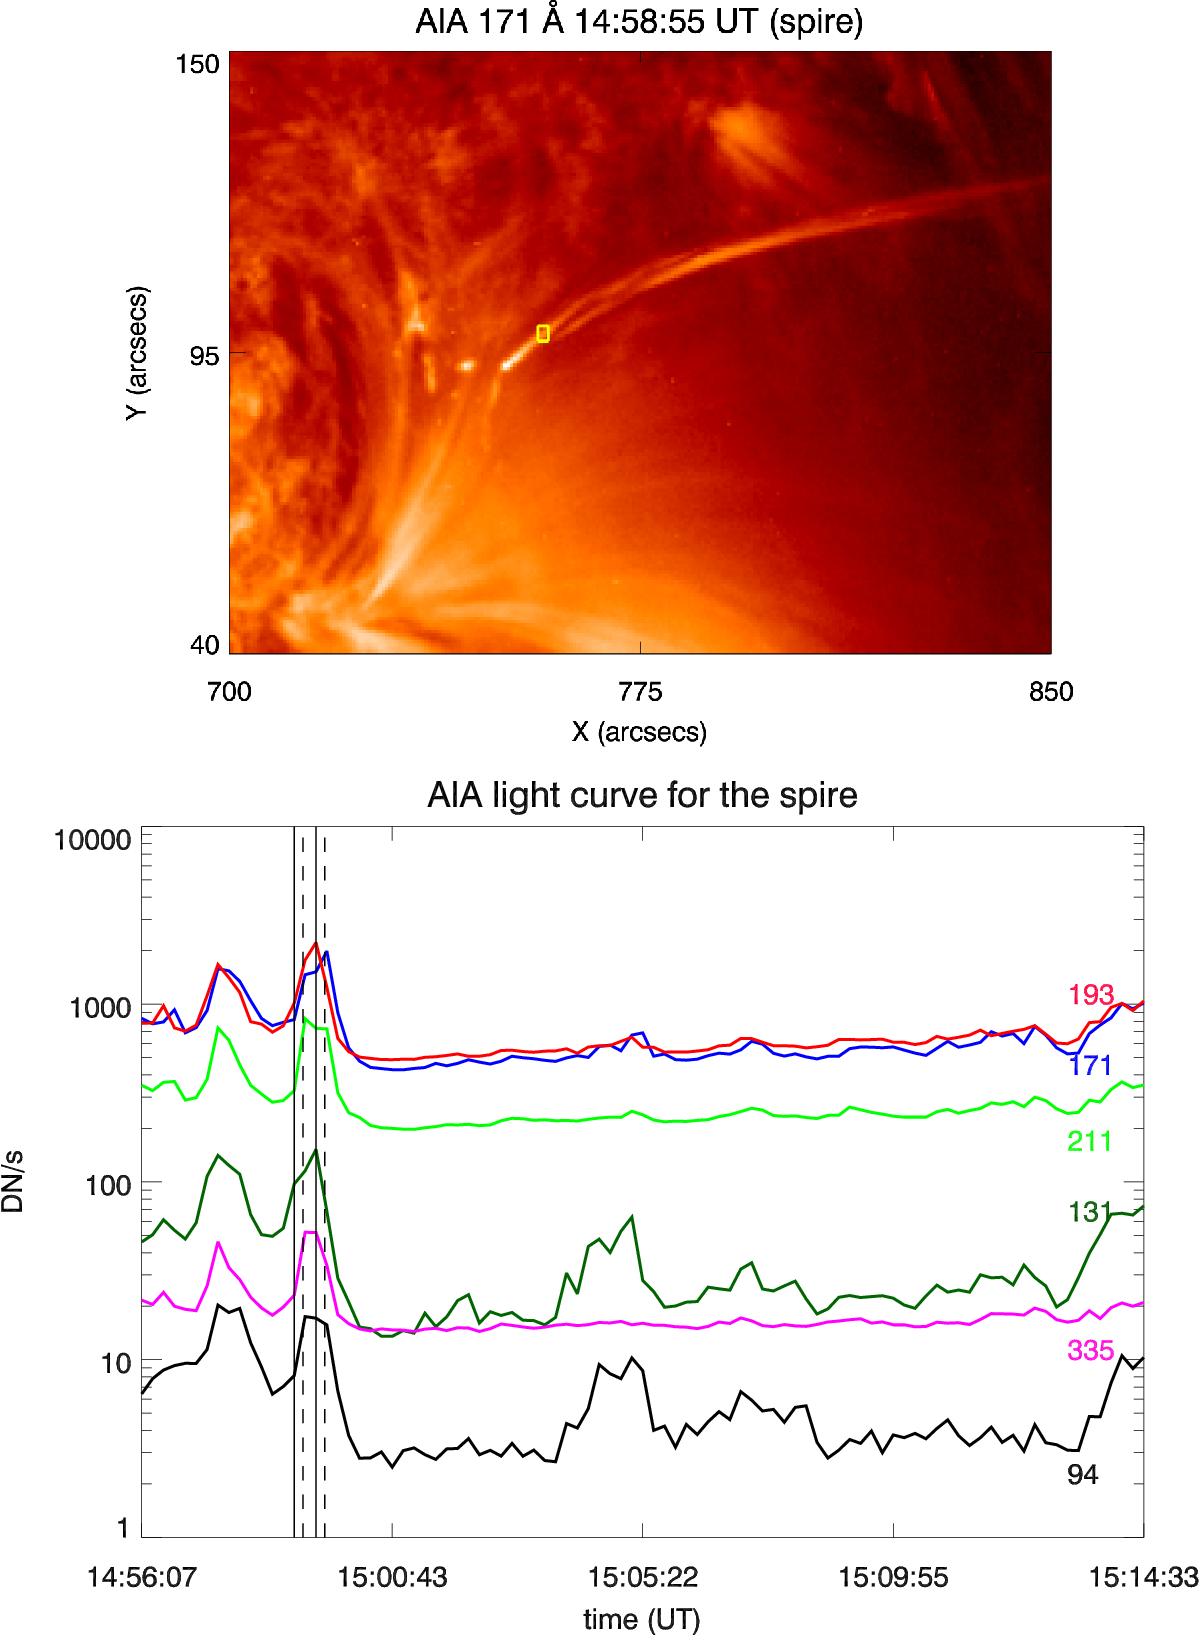
Top panel: AIA 171 Å image at 14:58 UT. The overplotted yellow box indicates the region of the jet spire selected for further analysis shown as a small box in Fig. 6 (top panel – first column). Bottom panel: temporal evolution of the jet spire calculated in the same small box using all AIA coronal channels. The overplotted solid lines indicate the EIS slit position start time for two exposures in which EIS observed the spire and dashed lines indicate the slit position end times.
Current usage metrics show cumulative count of Article Views (full-text article views including HTML views, PDF and ePub downloads, according to the available data) and Abstracts Views on Vision4Press platform.
Data correspond to usage on the plateform after 2015. The current usage metrics is available 48-96 hours after online publication and is updated daily on week days.
Initial download of the metrics may take a while.