Free Access
Fig. A.9
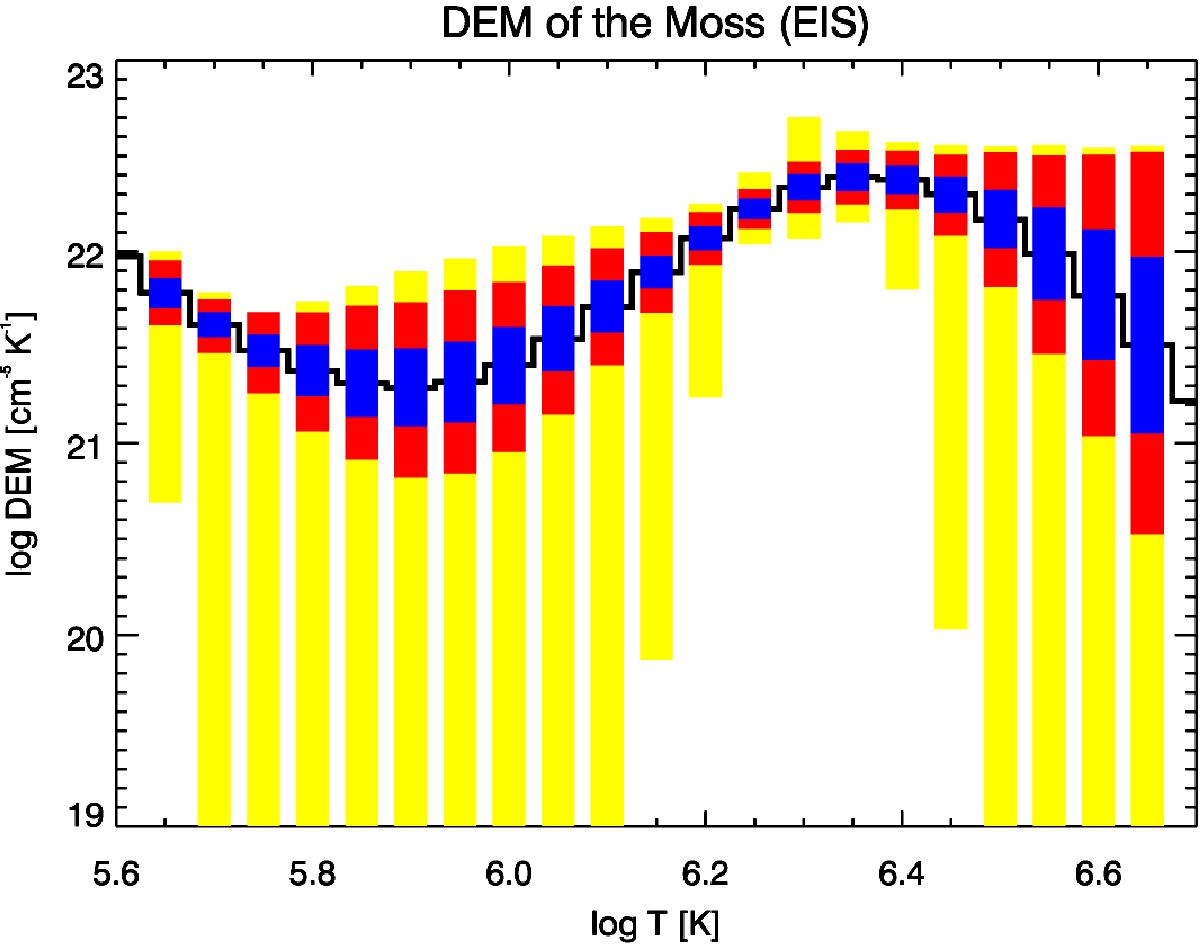
EIS DEM curve for the moss region. The blue rectangles represents 50%, red rectangles 80%, and yellow rectangles 95% of the MC solutions in each temperature bin.
Current usage metrics show cumulative count of Article Views (full-text article views including HTML views, PDF and ePub downloads, according to the available data) and Abstracts Views on Vision4Press platform.
Data correspond to usage on the plateform after 2015. The current usage metrics is available 48-96 hours after online publication and is updated daily on week days.
Initial download of the metrics may take a while.