Fig. 2
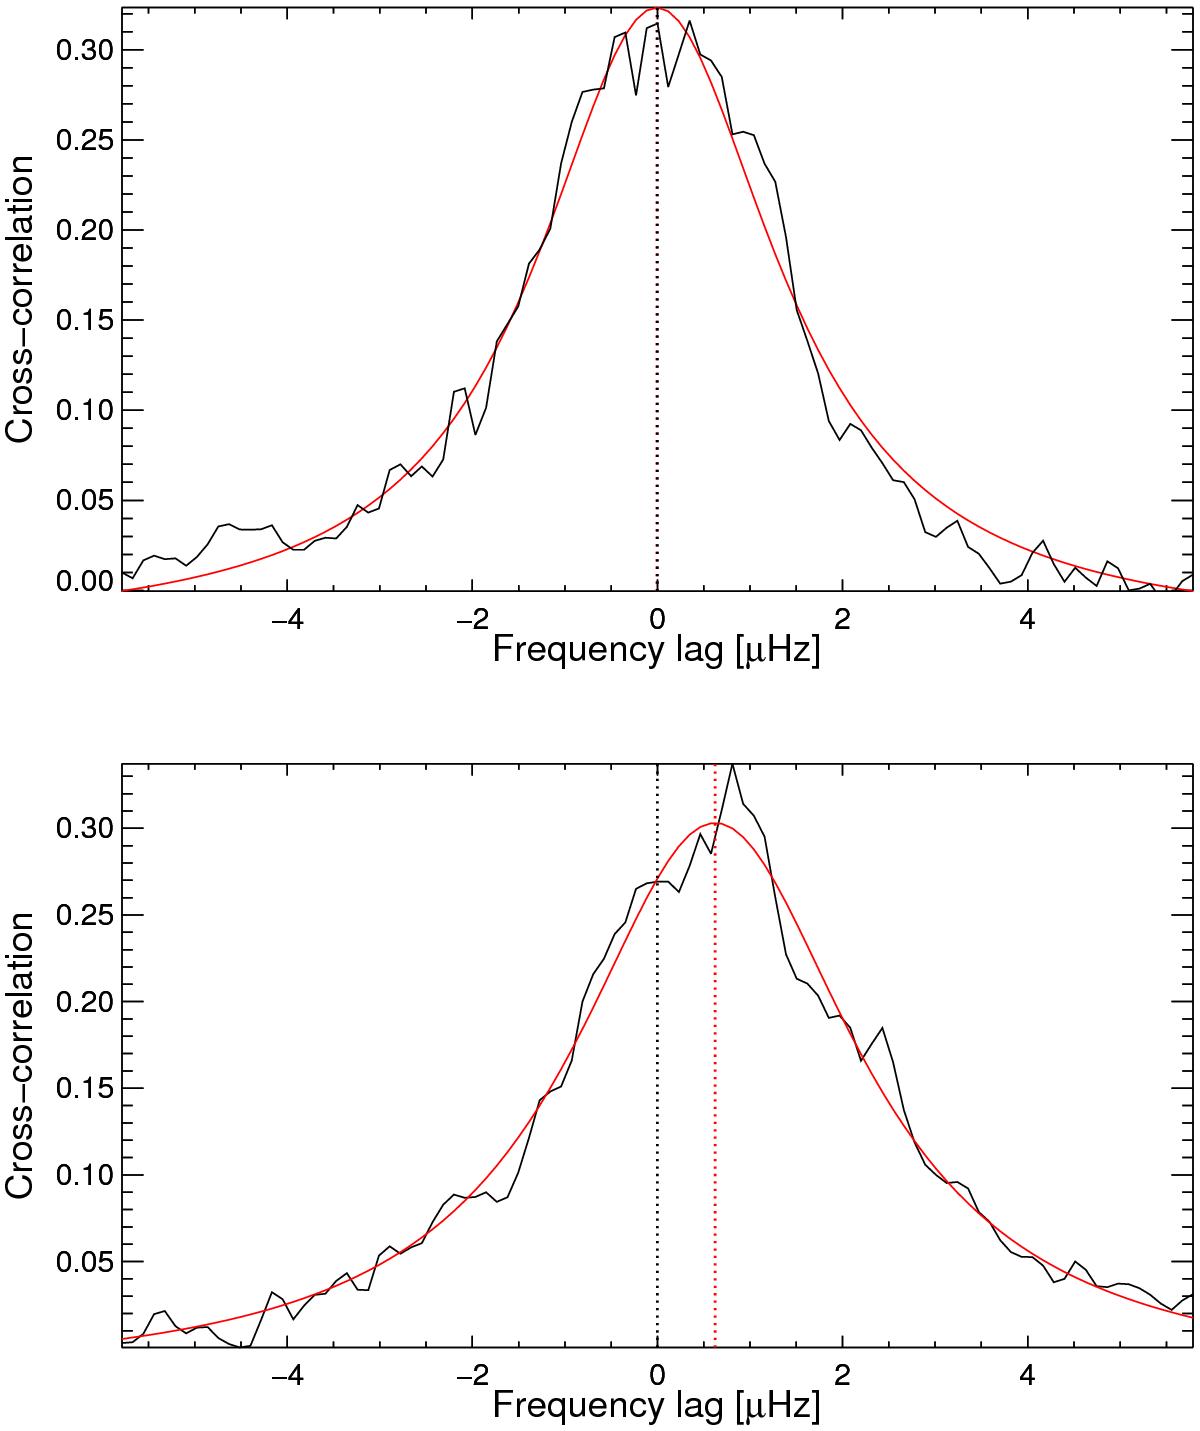
Top panel: cross-correlation between the part of interest of the LS-periodograms of two realisations of the first segment of KIC 8006161 (black). The Lorentzian fit to the cross-correlation is shown in red. The dotted black vertical line marks zero frequency lag, the dashed red line marks the centre of the fitted Lorentzian. Bottom panel: same as in the top panel, but for the cross-correlation between a realisation of the first and one of the nineteenth segment.
Current usage metrics show cumulative count of Article Views (full-text article views including HTML views, PDF and ePub downloads, according to the available data) and Abstracts Views on Vision4Press platform.
Data correspond to usage on the plateform after 2015. The current usage metrics is available 48-96 hours after online publication and is updated daily on week days.
Initial download of the metrics may take a while.