Fig. 9
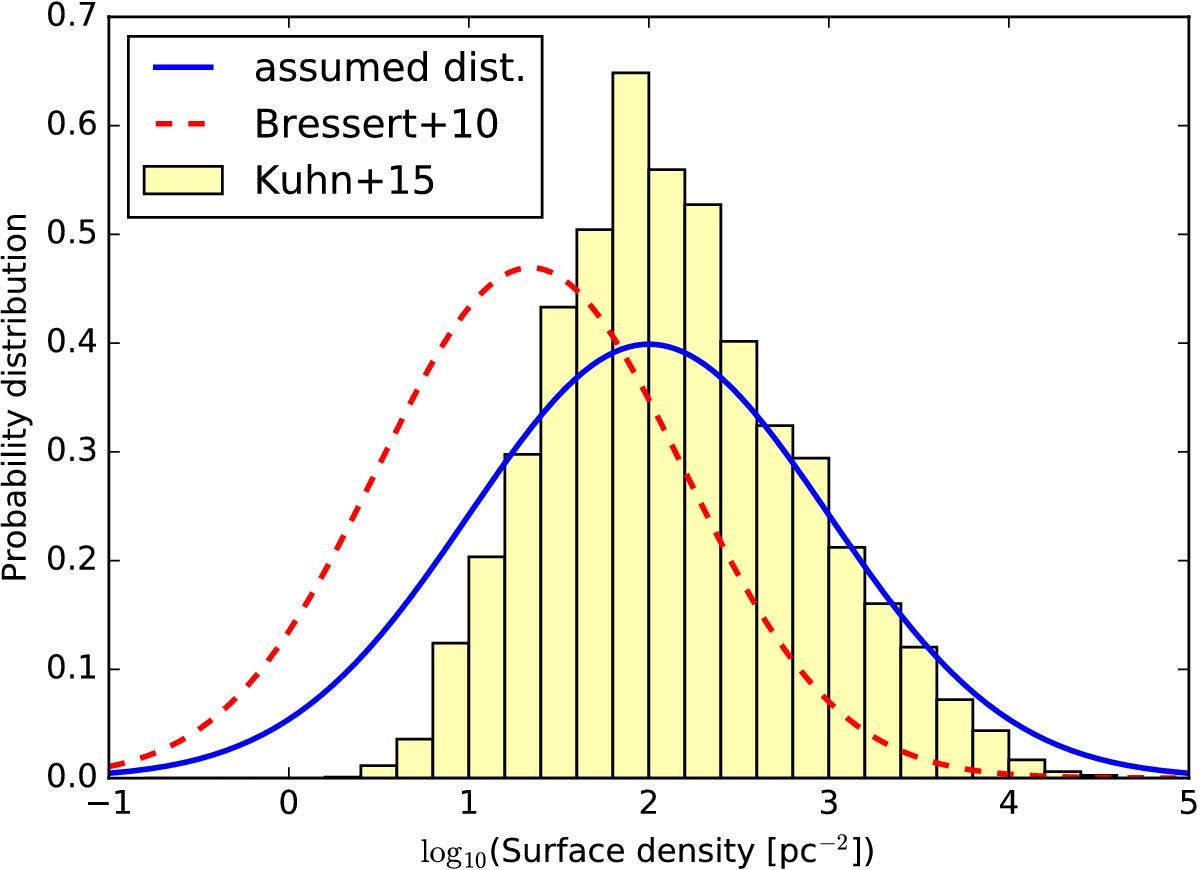
Probability distributions of YSO surface densities in units of pc-2 and logarithmic scale. The solid curve represents our assumed distribution for the clustering experiments (lognormal with mean μlog 10Σ = 2 and dispersion σlog 10Σ = 1), whereas the dashed curve indicates the distribution by Bressert et al. (2010) for several Spitzer-observed star-forming regions within 500 pc from the Sun (lognormal with mean μlog 10Σ = 1.34 and dispersion σlog 10Σ = 0.85). The normalized histogram is the combined surface density distribution of the 17 massive star-forming regions studied by Kuhn et al. (2015).
Current usage metrics show cumulative count of Article Views (full-text article views including HTML views, PDF and ePub downloads, according to the available data) and Abstracts Views on Vision4Press platform.
Data correspond to usage on the plateform after 2015. The current usage metrics is available 48-96 hours after online publication and is updated daily on week days.
Initial download of the metrics may take a while.