Fig. 8
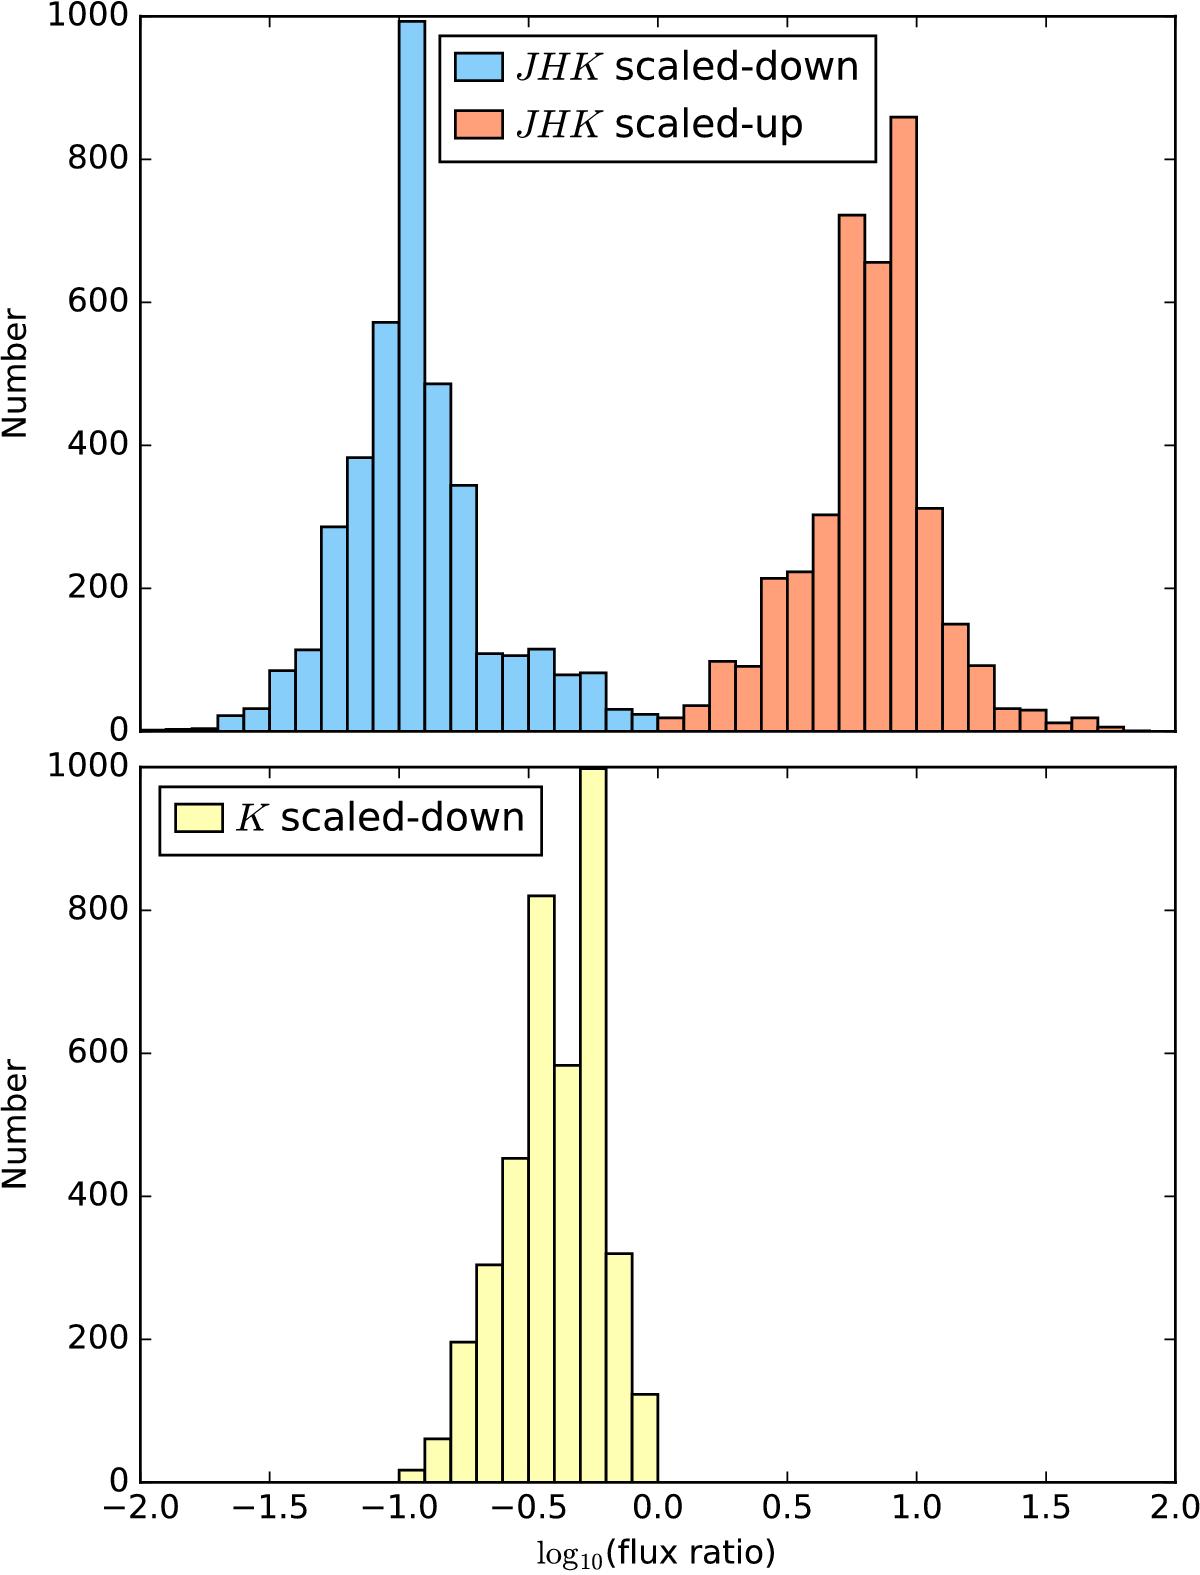
Histograms of ratios (in logarithmic scale) between the scaled fluxes and the original fluxes at the point of the transition from SED match to mismatch. The top panel shows the results for fluxes that were scaled by the same amount in the three JHK bands; these ratios were computed independently for scaled-up and scaled-down fluxes, and are presented here as two separated histograms. The bottom panel shows the distribution of ratios for scale-down K-band fluxes; in this case, the J- and H-band fluxes were kept constant.
Current usage metrics show cumulative count of Article Views (full-text article views including HTML views, PDF and ePub downloads, according to the available data) and Abstracts Views on Vision4Press platform.
Data correspond to usage on the plateform after 2015. The current usage metrics is available 48-96 hours after online publication and is updated daily on week days.
Initial download of the metrics may take a while.